A small move. A much bigger impact.
Borrowing changes the size of a gain—and the size of a loss. Explore both sides.
Try the interactive guide
Explore the new Economic Moat Atlas, alongside fifteen connected ideas for understanding money, markets, business, and borrowing. Clear explanations. Original visuals. Numbers you can explore.
AED 10,000 of equity. AED 40,000 of debt.
See the impact before interest and costs.
Fifteen businesses. Five visual stories. Explore the systems, networks and habits that make some companies harder to copy.
Explore economic moatsSelect an idea. Follow the numbers.
Keep the infographic.
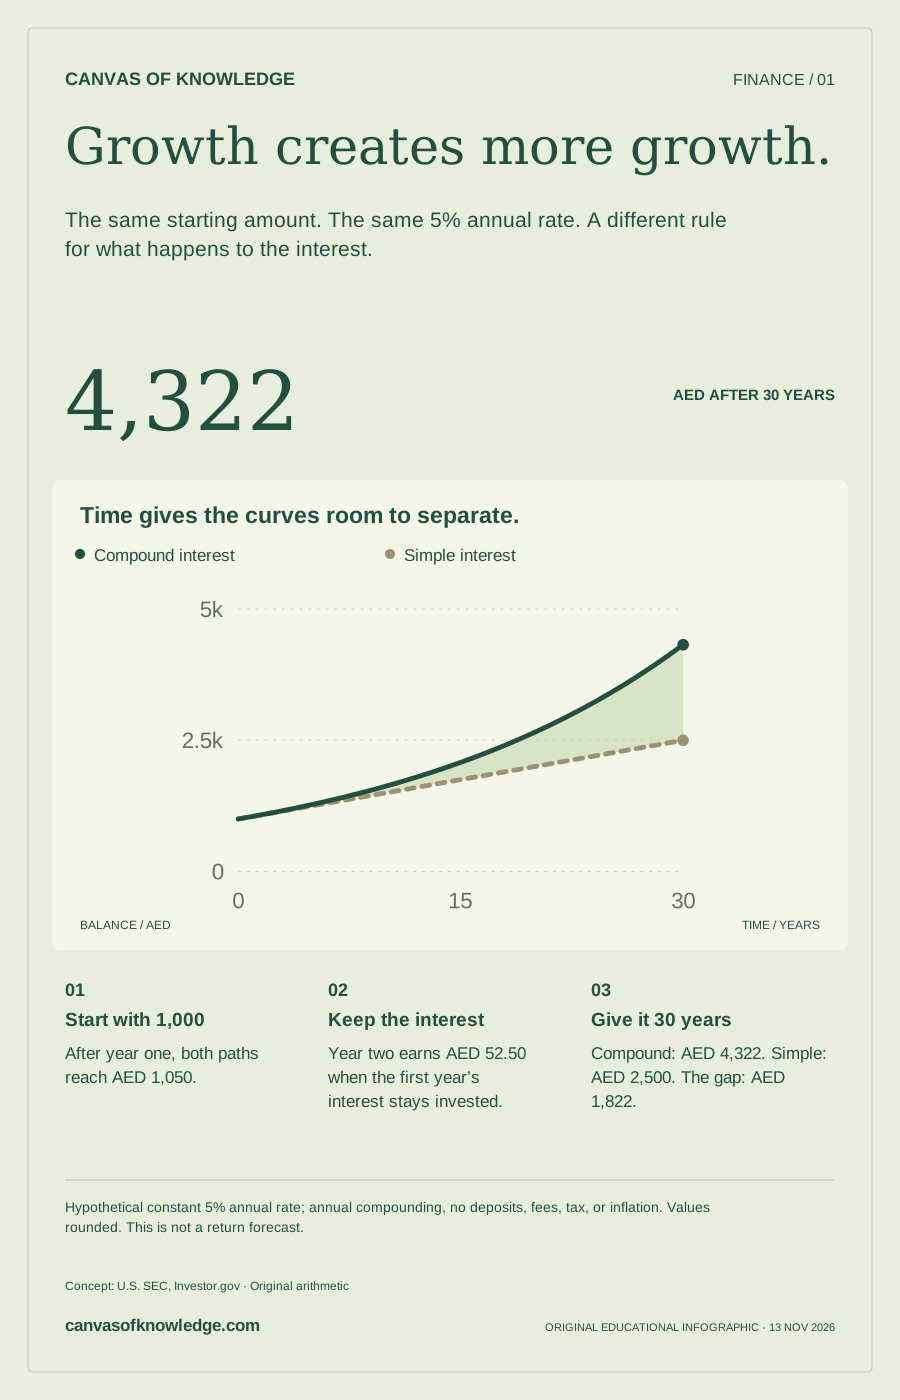
The same starting amount. The same 5% annual rate. A different rule for what happens to the interest.
From AED 1,000, with all interest reinvested.
Swipe across the chart to see every label →
After year one, both paths reach AED 1,050.
Year two earns AED 52.50 when the first year’s interest stays invested.
Compound: AED 4,322. Simple: AED 2,500. The gap: AED 1,822.
The extra growth comes from earning interest on earlier interest.
Hypothetical constant 5% annual rate; annual compounding, no deposits, fees, tax, or inflation. Values rounded. This is not a return forecast.Concept: U.S. SEC, Investor.gov · Original arithmetic.
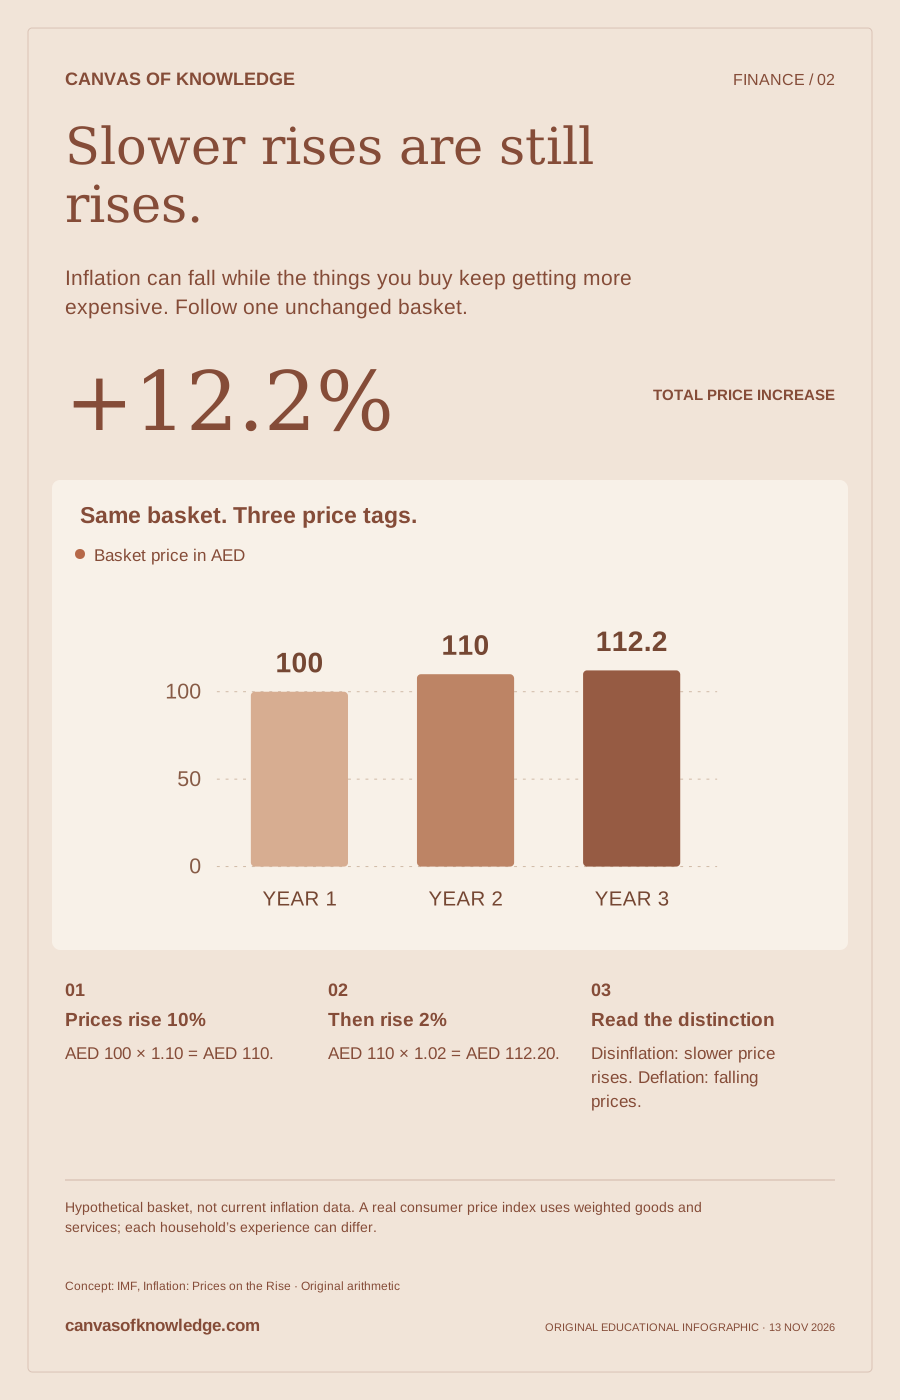
Inflation can fall while the things you buy keep getting more expensive. Follow one unchanged basket.
Across two successive increases of 10% and 2%.
Swipe across the chart to see every label →
AED 100 × 1.10 = AED 110.
AED 110 × 1.02 = AED 112.20.
Disinflation: slower price rises. Deflation: falling prices.
A lower inflation rate does not mean the old price comes back.
Hypothetical basket, not current inflation data. A real consumer price index uses weighted goods and services; each household’s experience can differ.Concept: IMF, Inflation: Prices on the Rise · Original arithmetic.
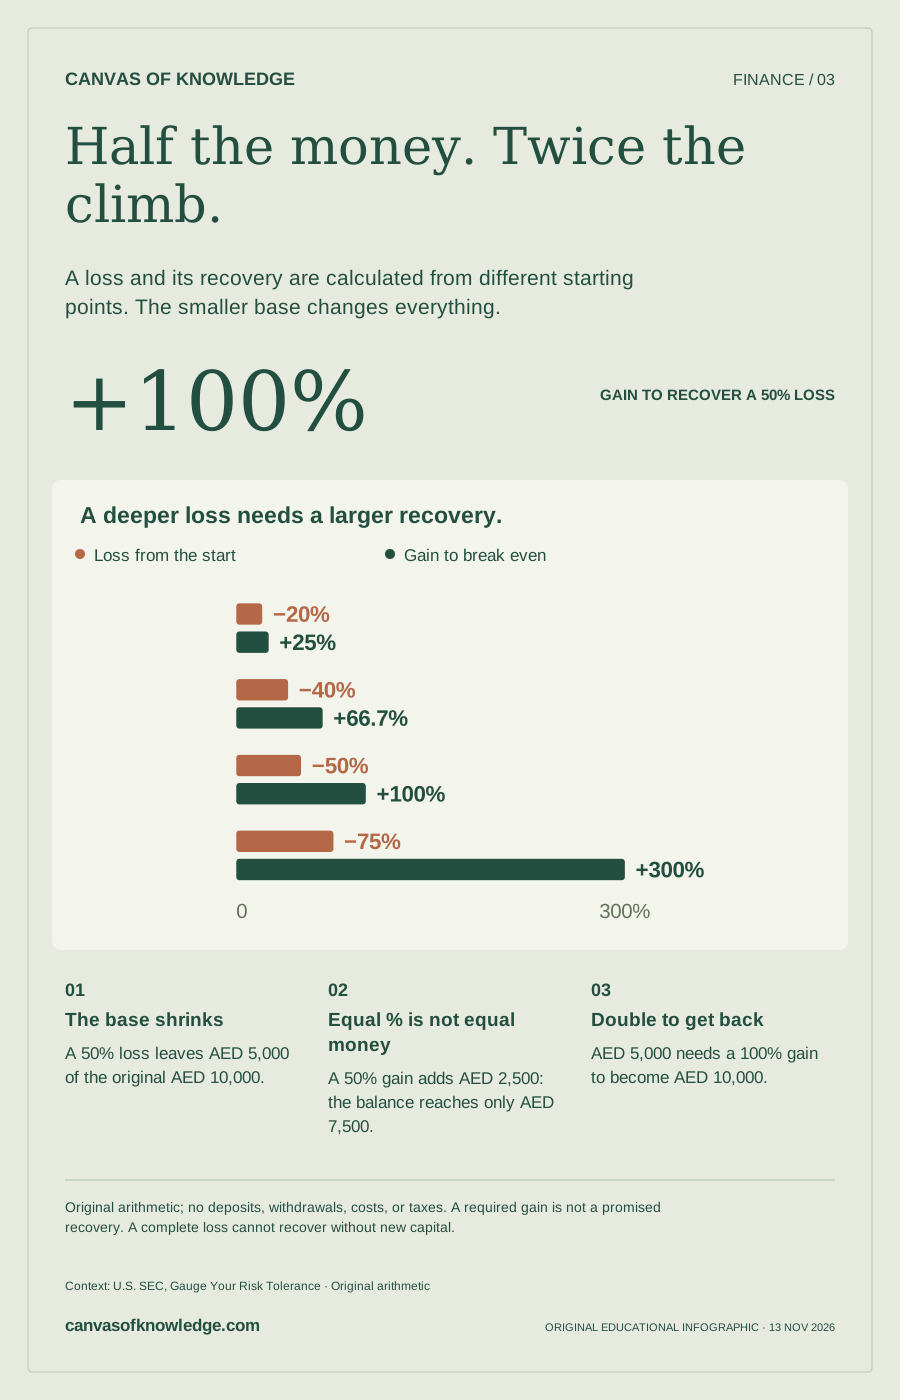
A loss and its recovery are calculated from different starting points. The smaller base changes everything.
AED 10,000 → AED 5,000 → AED 10,000.
Swipe across the chart to see every label →
A 50% loss leaves AED 5,000 of the original AED 10,000.
A 50% gain adds AED 2,500: the balance reaches only AED 7,500.
AED 5,000 needs a 100% gain to become AED 10,000.
Required recovery = loss ÷ (1 − loss), with the loss written as a decimal.
Original arithmetic; no deposits, withdrawals, costs, or taxes. A required gain is not a promised recovery. A complete loss cannot recover without new capital.Context: U.S. SEC, Gauge Your Risk Tolerance · Original arithmetic.
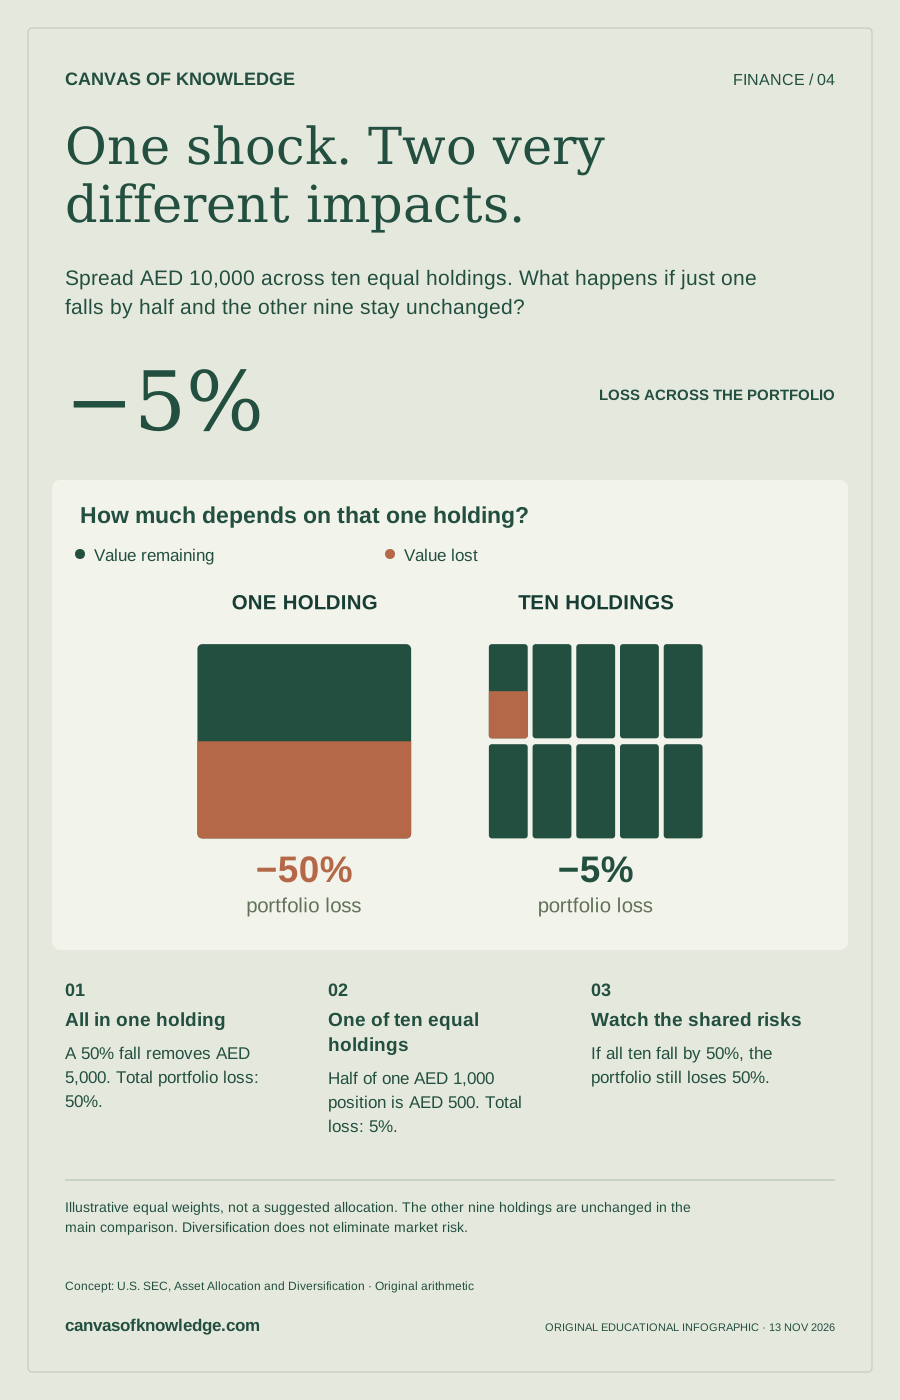
Spread AED 10,000 across ten equal holdings. What happens if just one falls by half and the other nine stay unchanged?
AED 500 lost from a total of AED 10,000.
Swipe across the chart to see every label →
A 50% fall removes AED 5,000. Total portfolio loss: 50%.
Half of one AED 1,000 position is AED 500. Total loss: 5%.
If all ten fall by 50%, the portfolio still loses 50%.
Count the underlying risks, not just the names in the portfolio.
Illustrative equal weights, not a suggested allocation. The other nine holdings are unchanged in the main comparison. Diversification does not eliminate market risk.Concept: U.S. SEC, Asset Allocation and Diversification · Original arithmetic.
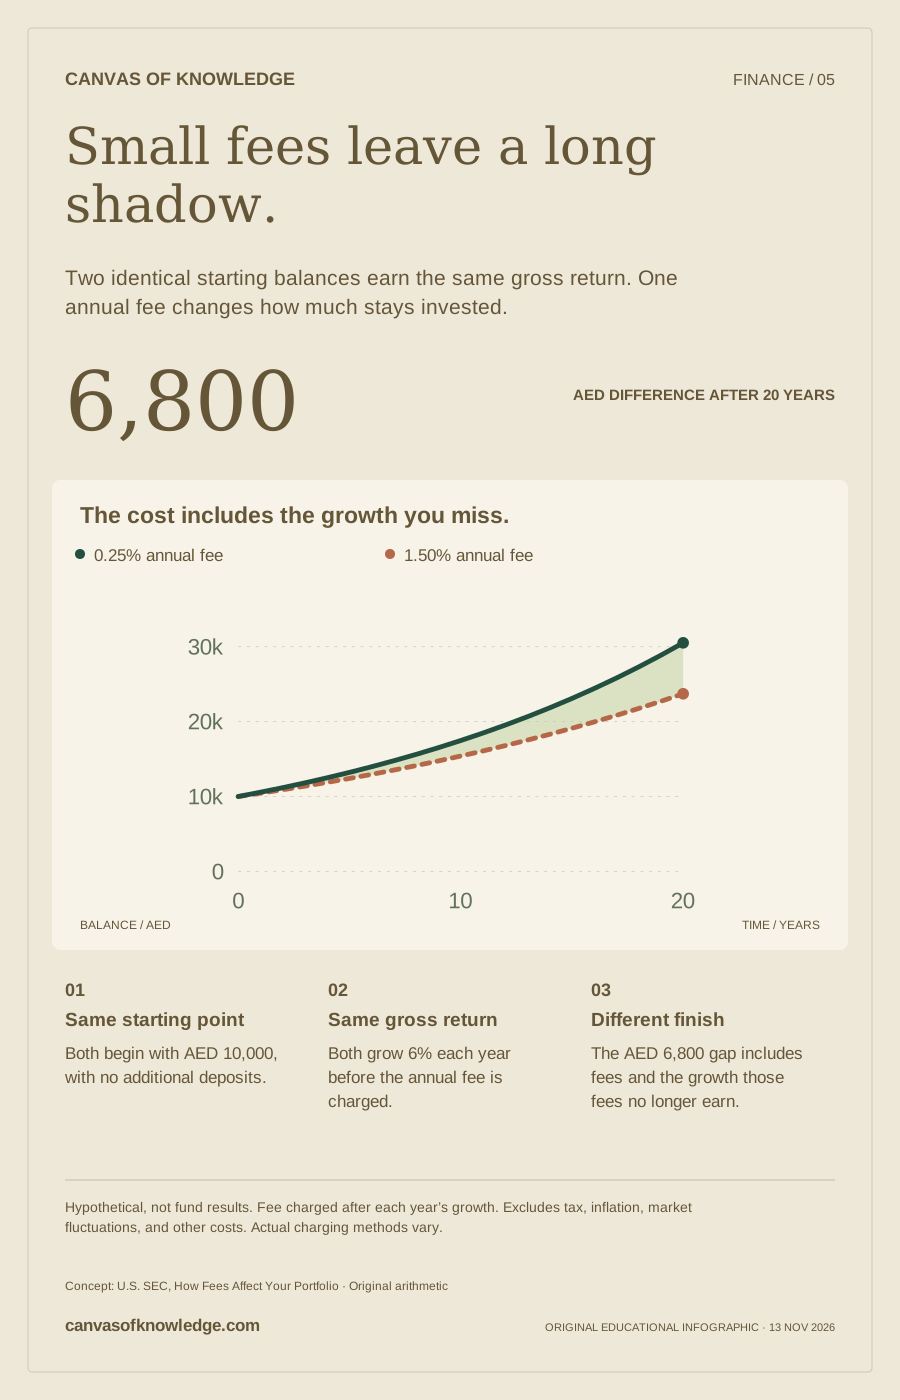
Two identical starting balances earn the same gross return. One annual fee changes how much stays invested.
A 0.25% annual fee compared with a 1.50% fee.
Swipe across the chart to see every label →
Both begin with AED 10,000, with no additional deposits.
Both grow 6% each year before the annual fee is charged.
The AED 6,800 gap includes fees and the growth those fees no longer earn.
A small annual percentage can create a much larger long-term difference.
Hypothetical, not fund results. Fee charged after each year’s growth. Excludes tax, inflation, market fluctuations, and other costs. Actual charging methods vary.Concept: U.S. SEC, How Fees Affect Your Portfolio · Original arithmetic.
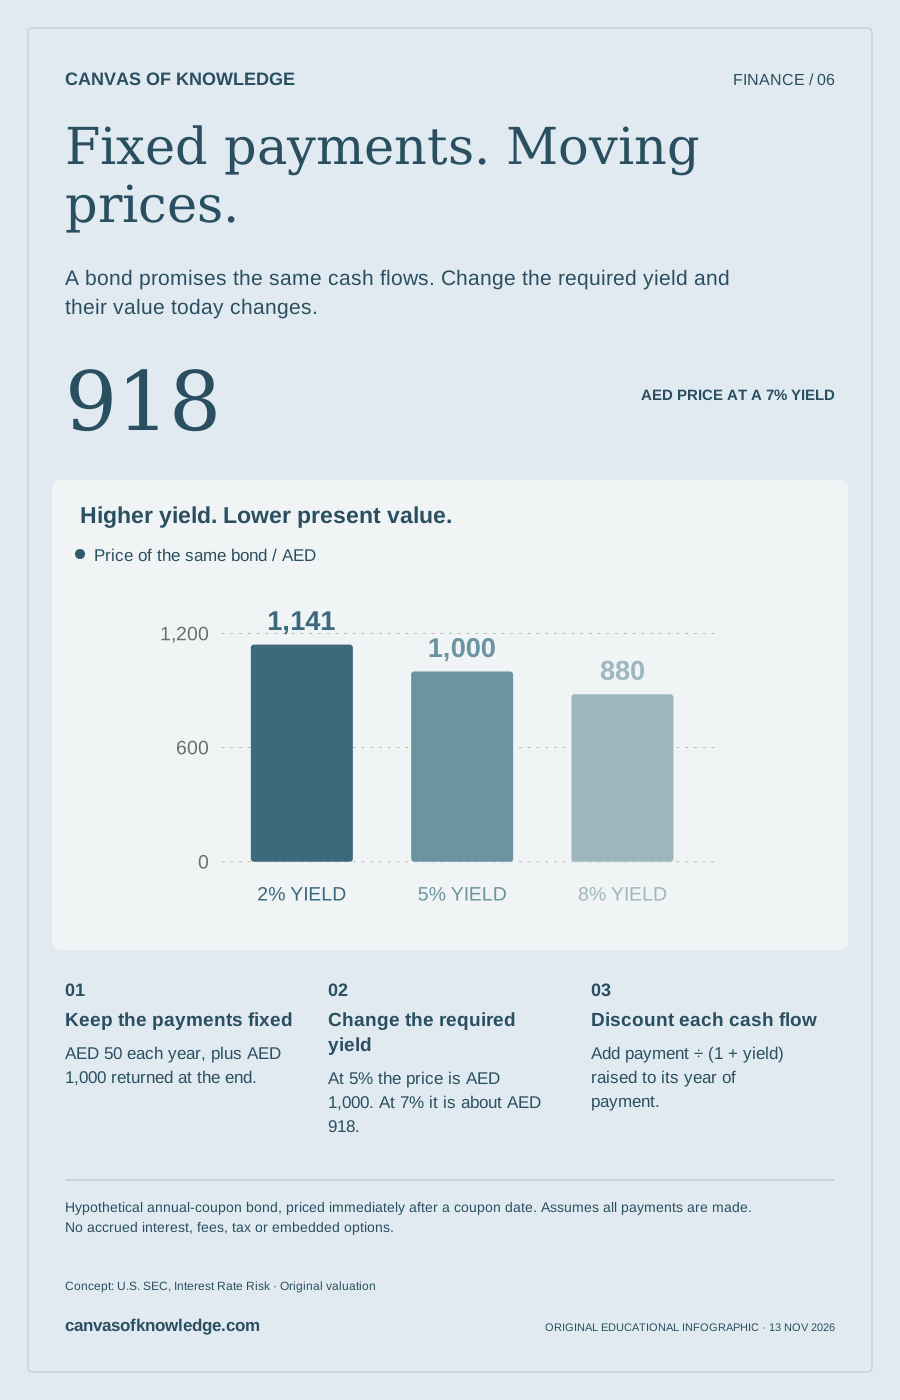
A bond promises the same cash flows. Change the required yield and their value today changes.
AED 1,000 face value. AED 50 a year. Five years left.
Swipe across the chart to see every label →
AED 50 each year, plus AED 1,000 returned at the end.
At 5% the price is AED 1,000. At 7% it is about AED 918.
Add payment ÷ (1 + yield) raised to its year of payment.
The coupon stays fixed. The market price adjusts to the required yield.
Hypothetical annual-coupon bond, priced immediately after a coupon date. Assumes all payments are made. No accrued interest, fees, tax or embedded options.Concept: U.S. SEC, Interest Rate Risk · Original valuation.
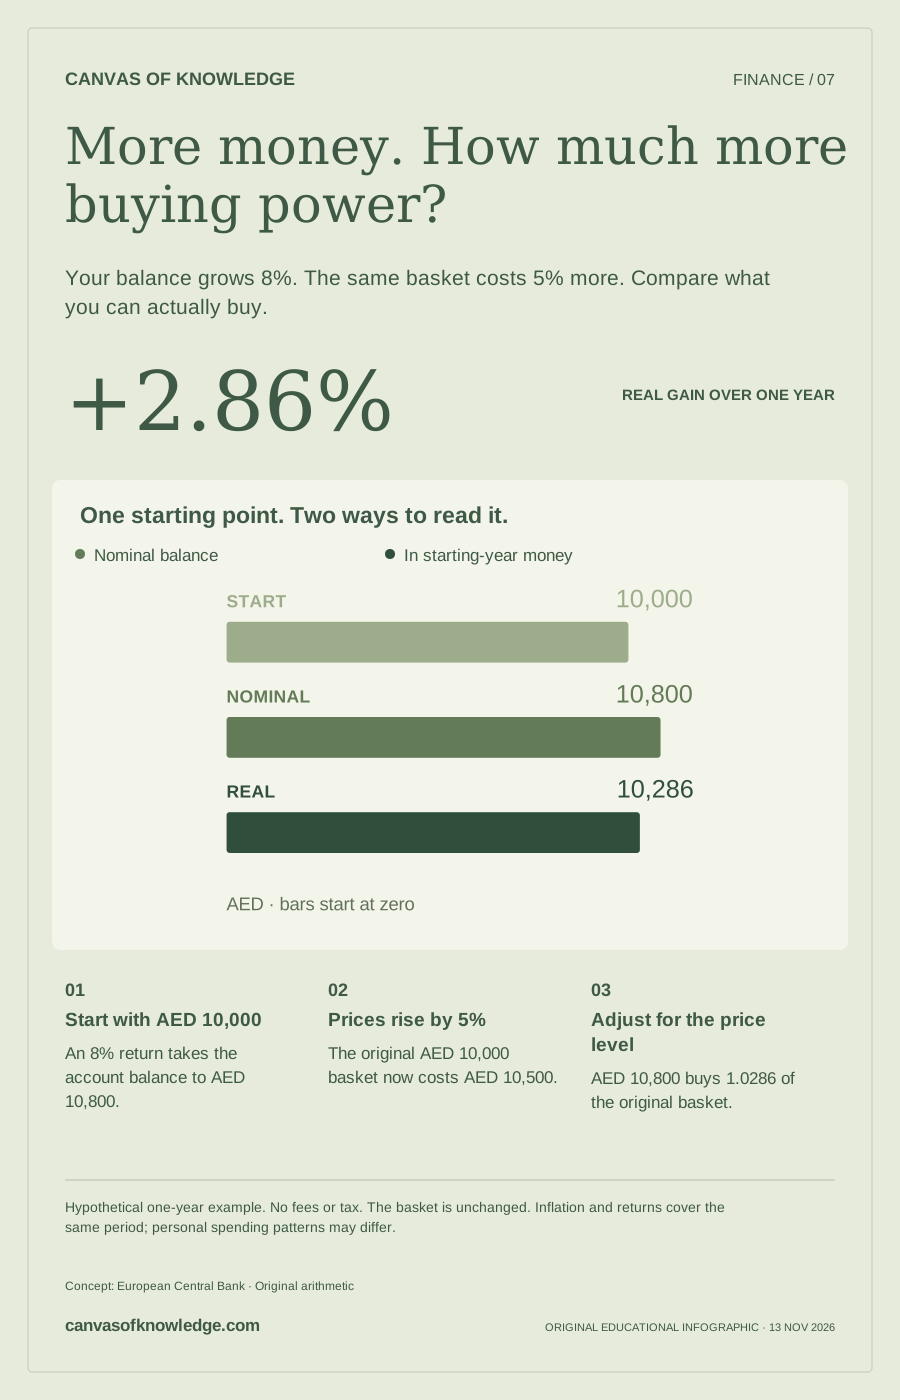
Your balance grows 8%. The same basket costs 5% more. Compare what you can actually buy.
Exact calculation: 1.08 ÷ 1.05 − 1.
Swipe across the chart to see every label →
An 8% return takes the account balance to AED 10,800.
The original AED 10,000 basket now costs AED 10,500.
AED 10,800 buys 1.0286 of the original basket.
Real return = (1 + nominal return) ÷ (1 + inflation) − 1.
Hypothetical one-year example. No fees or tax. The basket is unchanged. Inflation and returns cover the same period; personal spending patterns may differ.Concept: European Central Bank · Original arithmetic.
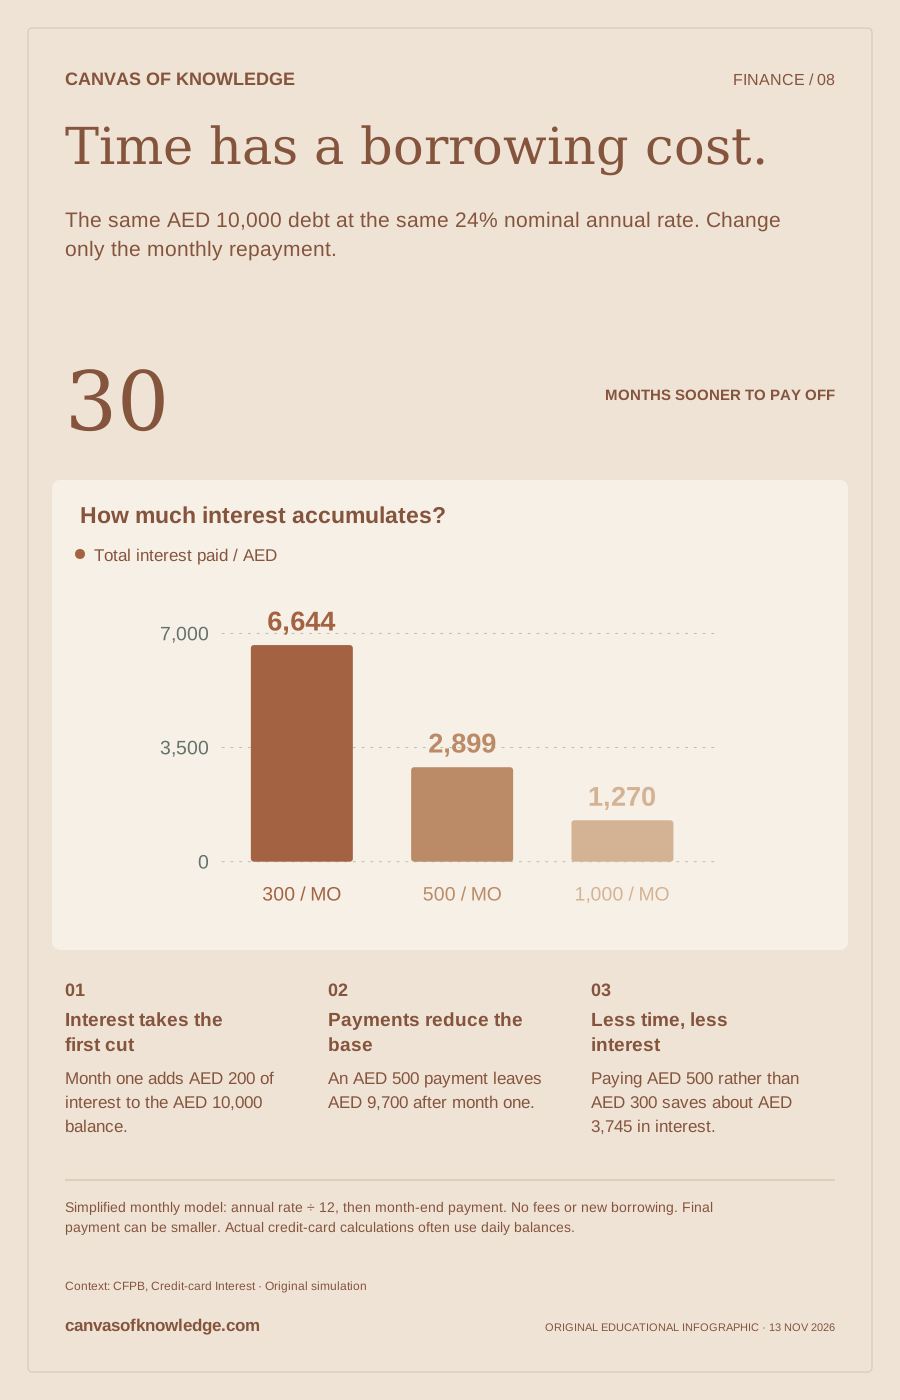
The same AED 10,000 debt at the same 24% nominal annual rate. Change only the monthly repayment.
AED 500/month instead of AED 300: 26 rather than 56 months.
Swipe across the chart to see every label →
Month one adds AED 200 of interest to the AED 10,000 balance.
An AED 500 payment leaves AED 9,700 after month one.
Paying AED 500 rather than AED 300 saves about AED 3,745 in interest.
A larger payment leaves less debt on which the next month’s interest is charged.
Simplified monthly model: annual rate ÷ 12, then month-end payment. No fees or new borrowing. Final payment can be smaller. Actual credit-card calculations often use daily balances.Context: CFPB, Credit-card Interest · Original simulation.
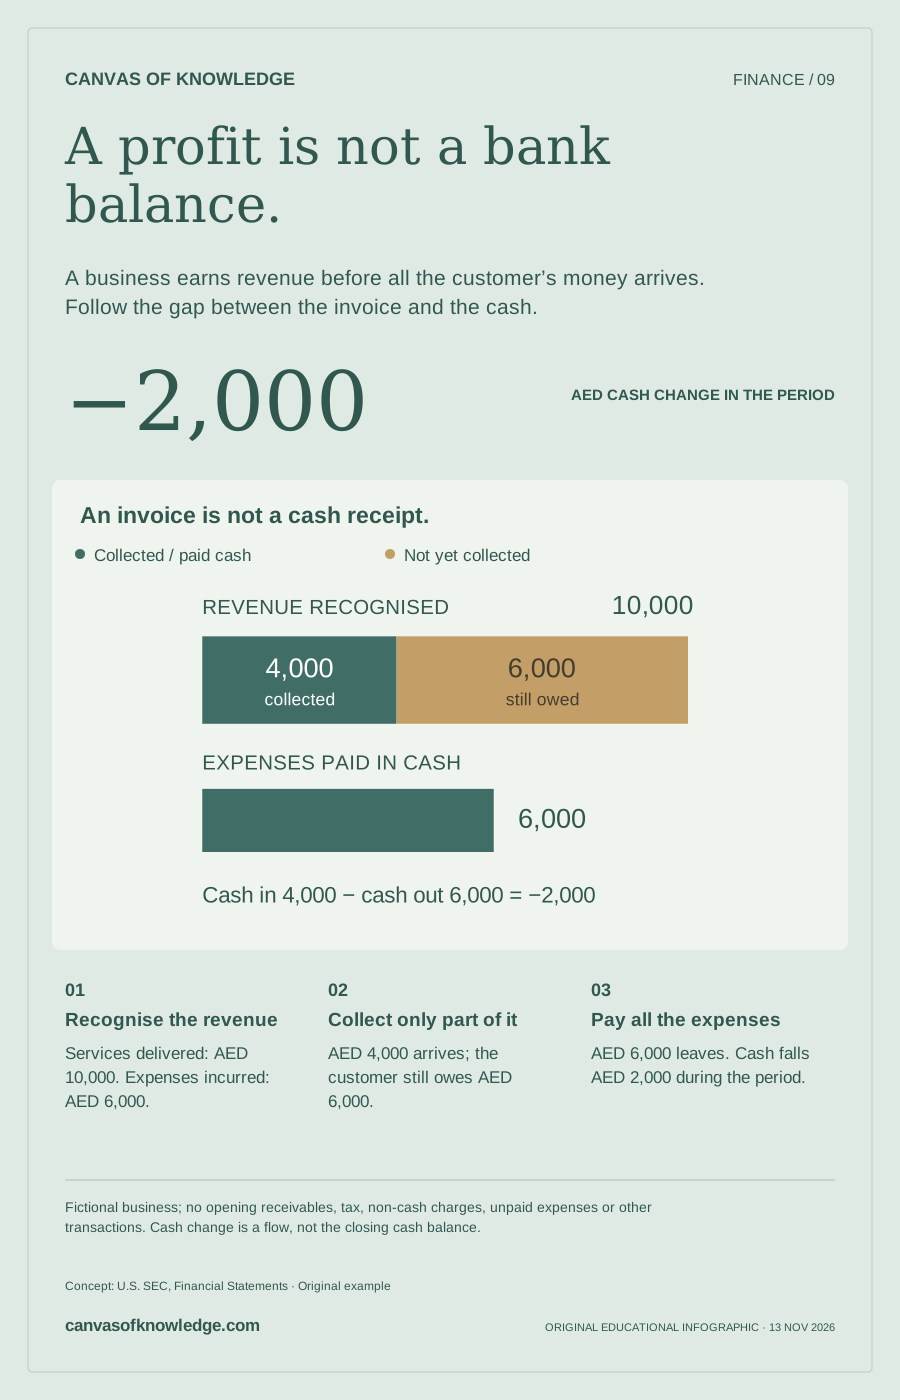
A business earns revenue before all the customer’s money arrives. Follow the gap between the invoice and the cash.
Even with AED 4,000 of profit.
Swipe across the chart to see every label →
Services delivered: AED 10,000. Expenses incurred: AED 6,000.
AED 4,000 arrives; the customer still owes AED 6,000.
AED 6,000 leaves. Cash falls AED 2,000 during the period.
Profit AED 4,000 − increase in receivables AED 6,000 = cash flow −AED 2,000.
Fictional business; no opening receivables, tax, non-cash charges, unpaid expenses or other transactions. Cash change is a flow, not the closing cash balance.Concept: U.S. SEC, Financial Statements · Original example.
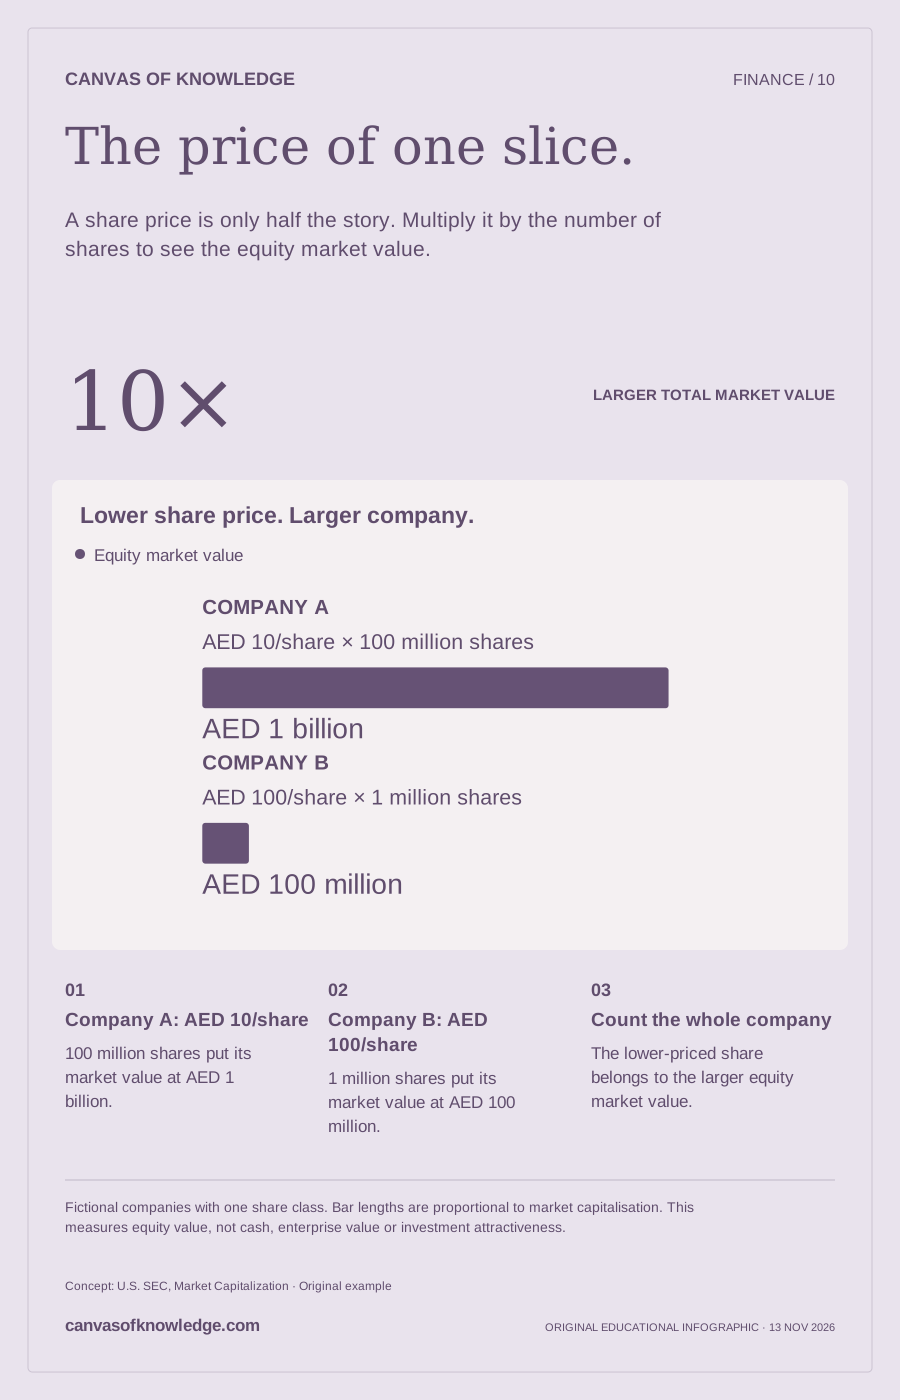
A share price is only half the story. Multiply it by the number of shares to see the equity market value.
Company A is worth ten times B in this fictional comparison.
Swipe across the chart to see every label →
100 million shares put its market value at AED 1 billion.
1 million shares put its market value at AED 100 million.
The lower-priced share belongs to the larger equity market value.
Market capitalisation = share price × shares outstanding.
Fictional companies with one share class. Bar lengths are proportional to market capitalisation. This measures equity value, not cash, enterprise value or investment attractiveness.Concept: U.S. SEC, Market Capitalization · Original example.
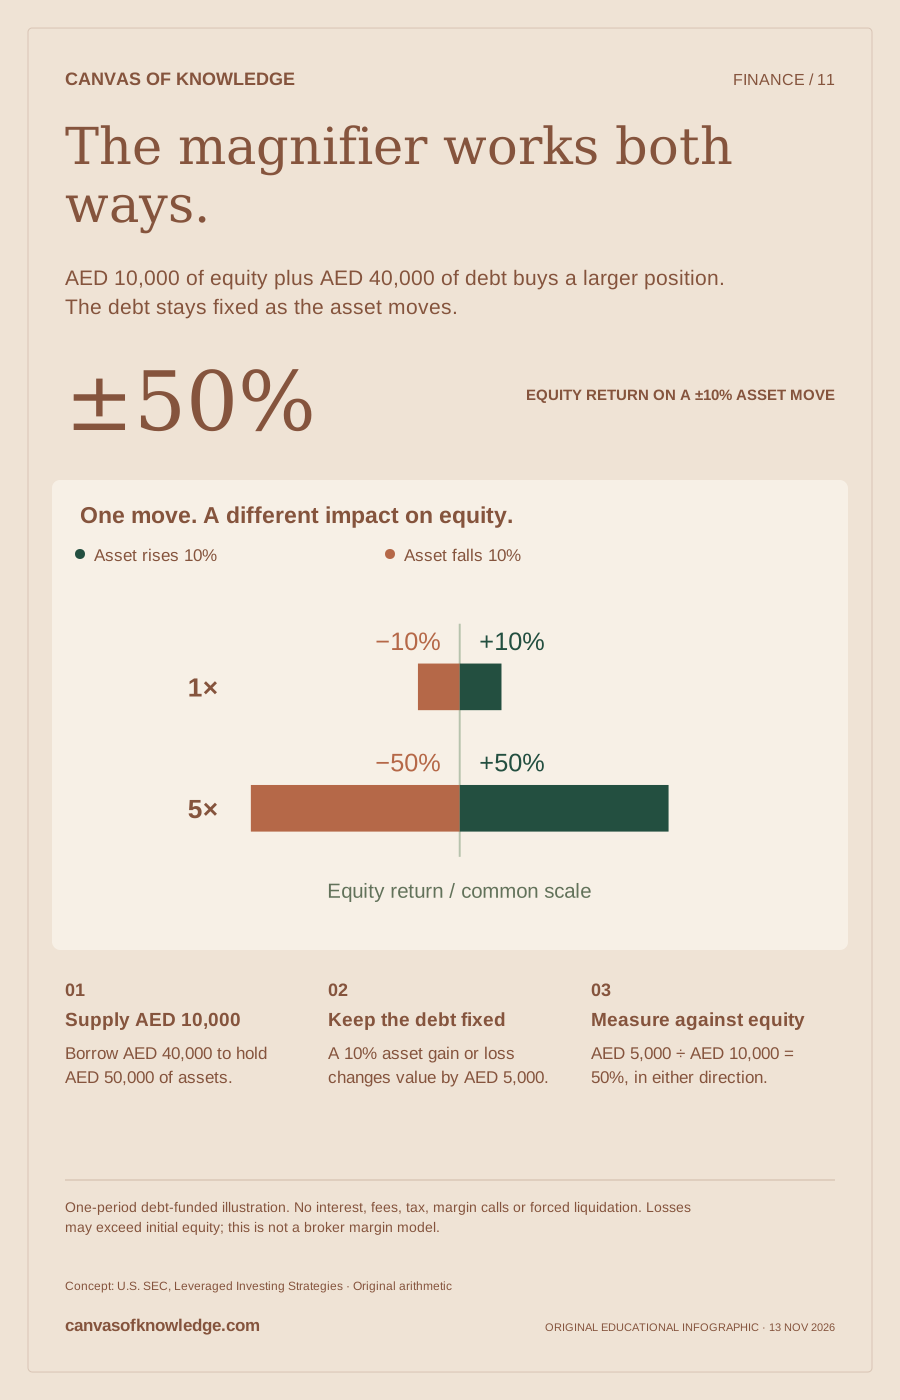
AED 10,000 of equity plus AED 40,000 of debt buys a larger position. The debt stays fixed as the asset moves.
Five times the initial exposure. Five times the impact.
Swipe across the chart to see every label →
Borrow AED 40,000 to hold AED 50,000 of assets.
A 10% asset gain or loss changes value by AED 5,000.
AED 5,000 ÷ AED 10,000 = 50%, in either direction.
More exposure makes both the upside and the downside larger.
One-period debt-funded illustration. No interest, fees, tax, margin calls or forced liquidation. Losses may exceed initial equity; this is not a broker margin model.Concept: U.S. SEC, Leveraged Investing Strategies · Original arithmetic.
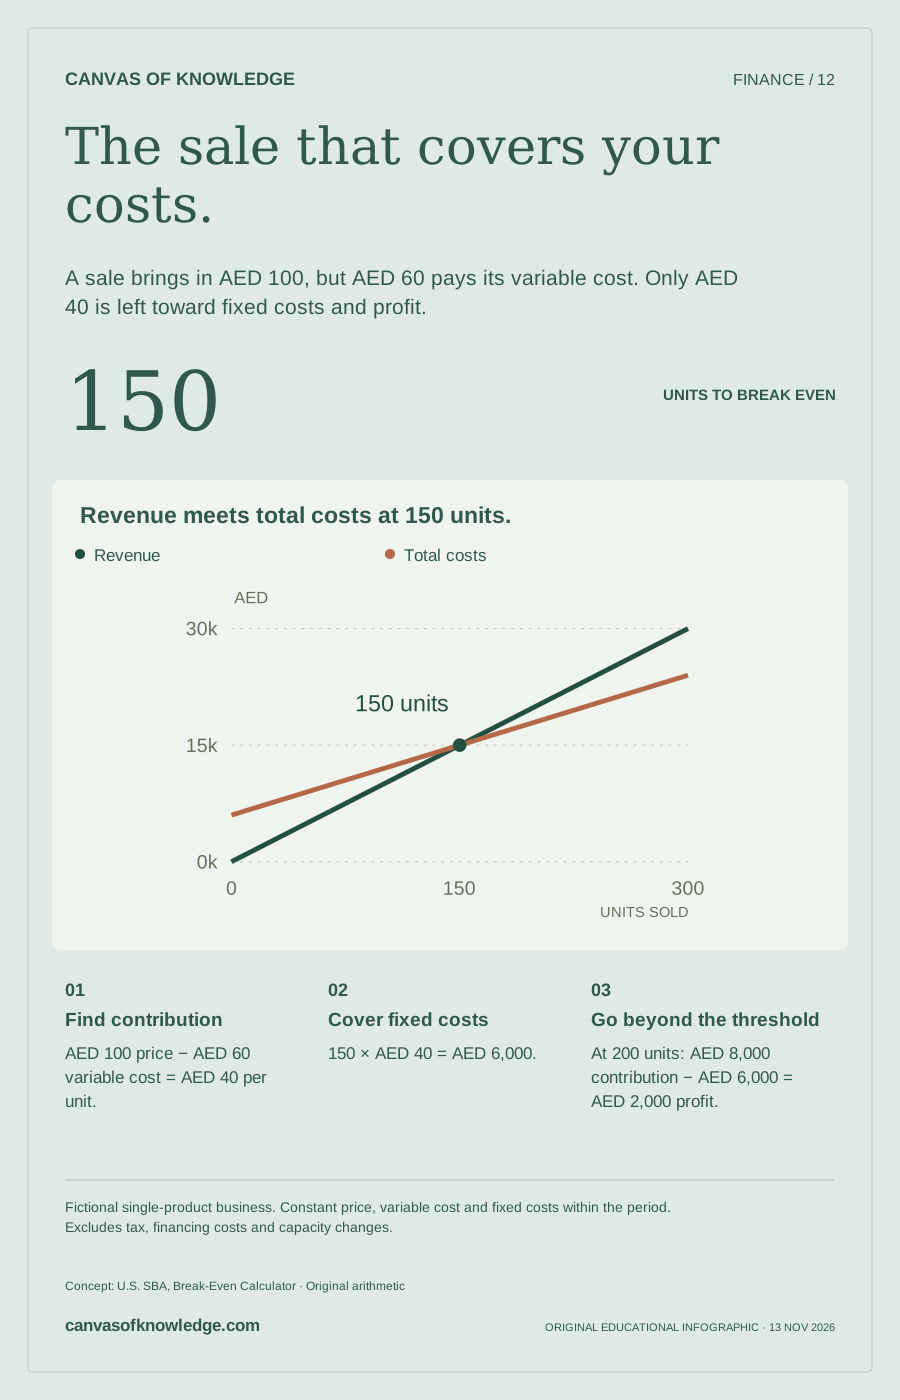
A sale brings in AED 100, but AED 60 pays its variable cost. Only AED 40 is left toward fixed costs and profit.
AED 6,000 fixed costs ÷ AED 40 contribution per unit.
Swipe across the chart to see every label →
AED 100 price − AED 60 variable cost = AED 40 per unit.
150 × AED 40 = AED 6,000.
At 200 units: AED 8,000 contribution − AED 6,000 = AED 2,000 profit.
Break-even units = fixed costs ÷ contribution per unit.
Fictional single-product business. Constant price, variable cost and fixed costs within the period. Excludes tax, financing costs and capacity changes.Concept: U.S. SBA, Break-Even Calculator · Original arithmetic.
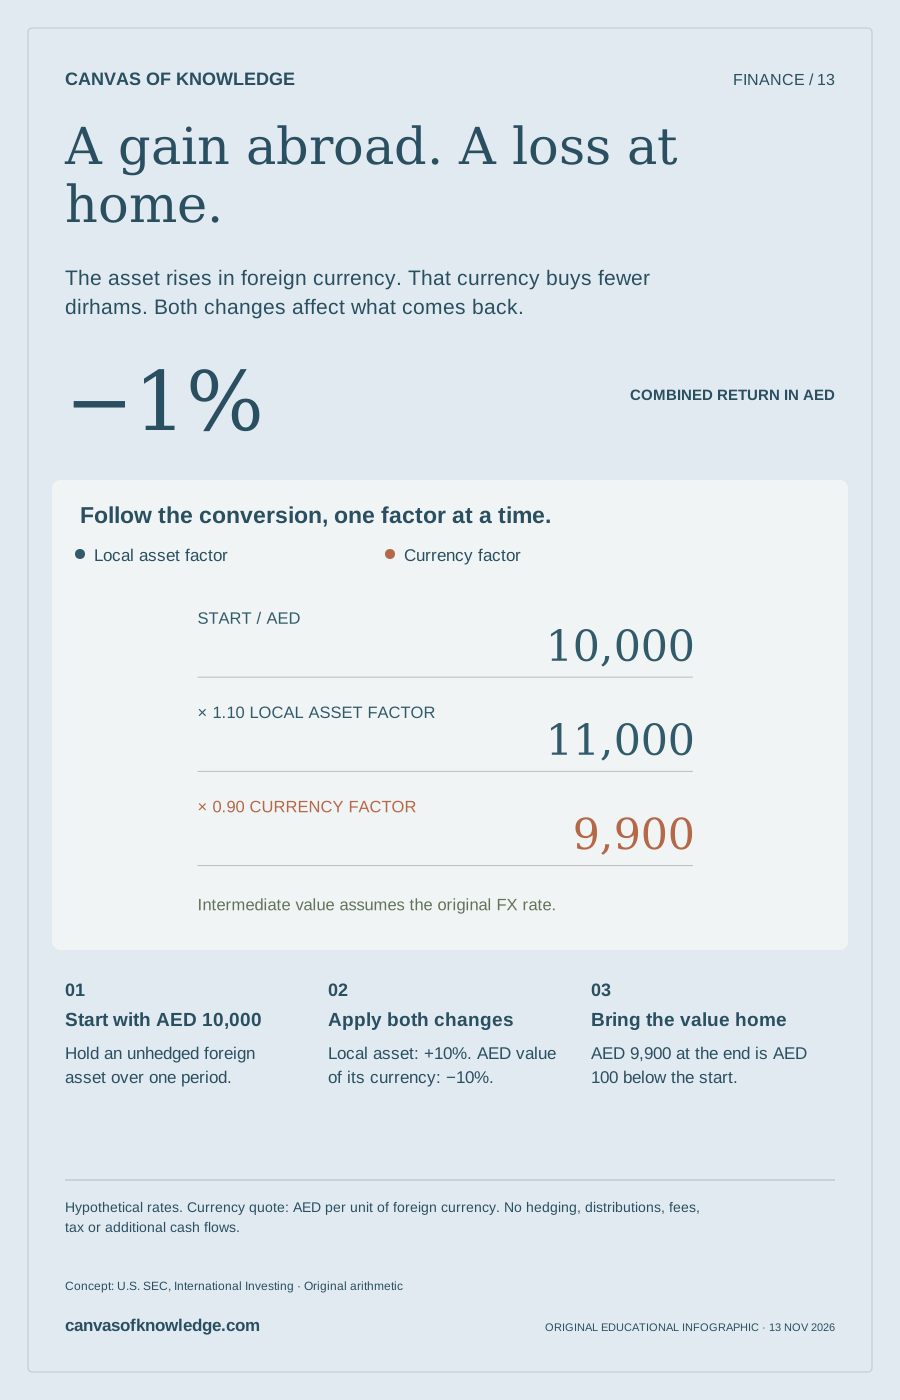
The asset rises in foreign currency. That currency buys fewer dirhams. Both changes affect what comes back.
A 10% local gain paired with a 10% currency decline.
Swipe across the chart to see every label →
Hold an unhedged foreign asset over one period.
Local asset: +10%. AED value of its currency: −10%.
AED 9,900 at the end is AED 100 below the start.
Home return = (1 + asset return) × (1 + currency return) − 1.
Hypothetical rates. Currency quote: AED per unit of foreign currency. No hedging, distributions, fees, tax or additional cash flows.Concept: U.S. SEC, International Investing · Original arithmetic.
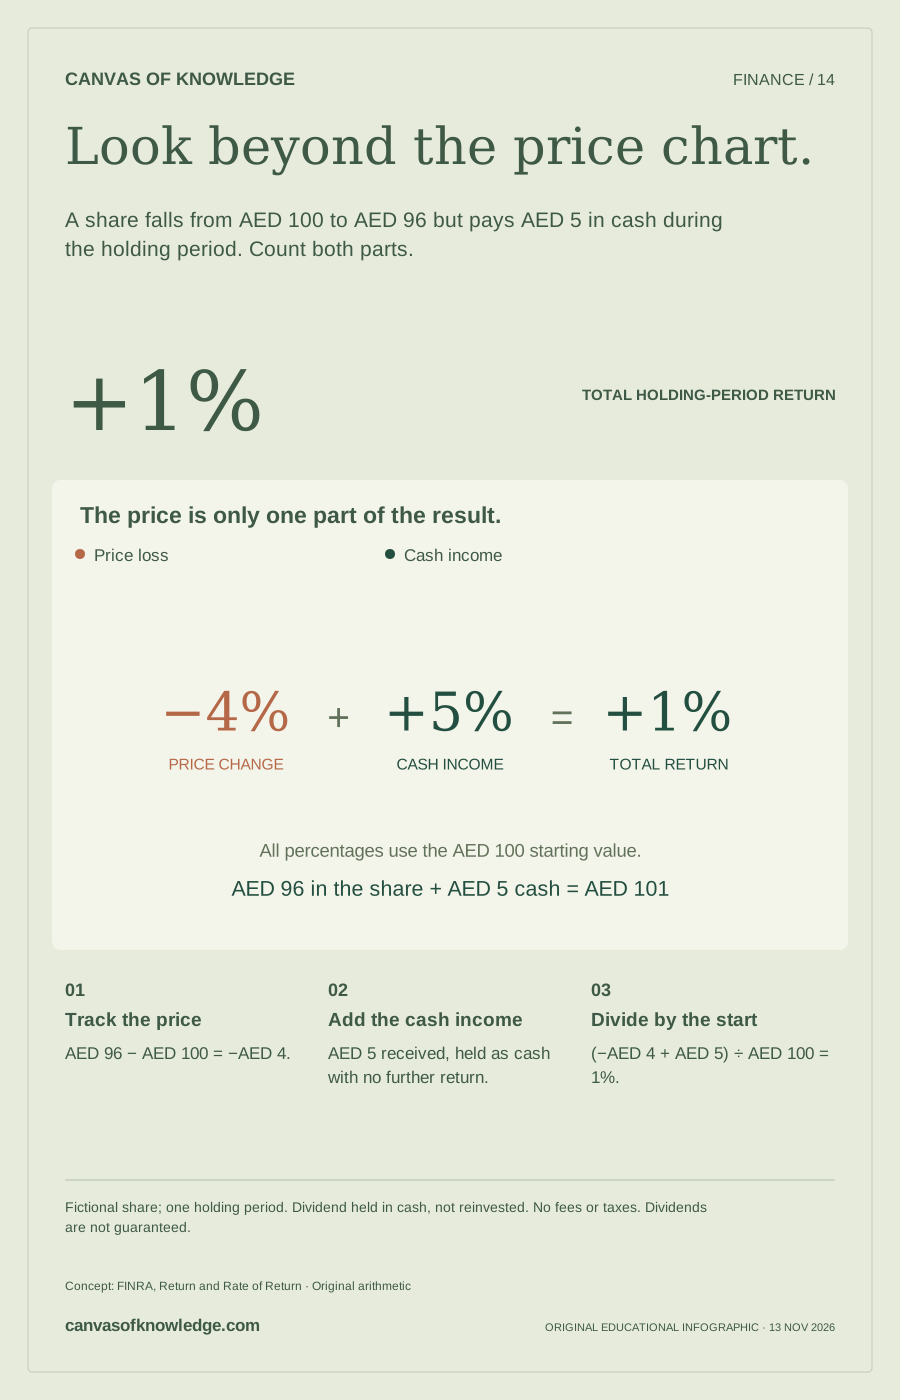
A share falls from AED 100 to AED 96 but pays AED 5 in cash during the holding period. Count both parts.
−4% price return + 5% cash income on the starting value.
Swipe across the chart to see every label →
AED 96 − AED 100 = −AED 4.
AED 5 received, held as cash with no further return.
(−AED 4 + AED 5) ÷ AED 100 = 1%.
Price change plus income gives the whole holding-period picture.
Fictional share; one holding period. Dividend held in cash, not reinvested. No fees or taxes. Dividends are not guaranteed.Concept: FINRA, Return and Rate of Return · Original arithmetic.
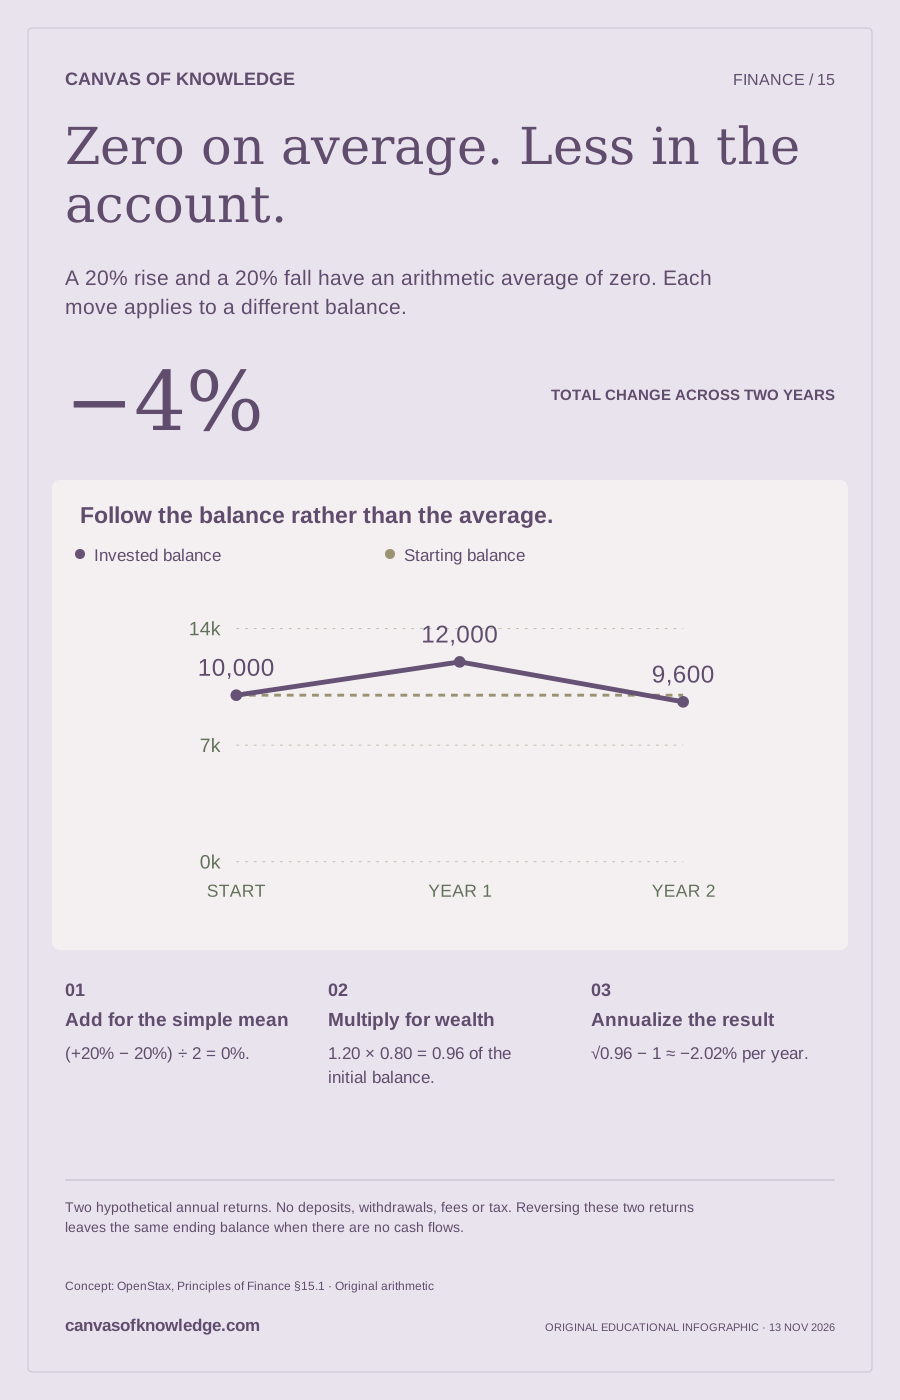
A 20% rise and a 20% fall have an arithmetic average of zero. Each move applies to a different balance.
AED 10,000 → AED 12,000 → AED 9,600.
Swipe across the chart to see every label →
(+20% − 20%) ÷ 2 = 0%.
1.20 × 0.80 = 0.96 of the initial balance.
√0.96 − 1 ≈ −2.02% per year.
The arithmetic mean and the compound growth rate answer different questions.
Two hypothetical annual returns. No deposits, withdrawals, fees or tax. Reversing these two returns leaves the same ending balance when there are no cash flows.Concept: OpenStax, Principles of Finance §15.1 · Original arithmetic.
Your starting equity stays at AED 10,000. Adjust the initial asset exposure and the asset’s percentage change.
One-period debt-funded model. Debt principal stays fixed. No interest, fees, taxes, margin calls or forced sales. Actual financing can trigger liquidation before this endpoint.
Understand the example →Ending equity: AED 5,000.
Assets = starting equity × initial leverage. Debt = assets − starting equity. Ending equity = assets × (1 + asset return) − debt. Equity return = initial leverage × asset return. Negative equity means a debt shortfall in this simplified model.
Follow the sequence or jump into whatever has your attention. Reading estimates are based on the length of each lesson; take your time with the interactive guides.
Borrowing changes the size of a gain—and the size of a loss. Explore both sides.
Separate revenue from contribution, then find the point where a business covers its costs.
An overseas investment has two moving parts: the asset and the currency used to value it.
A price chart leaves out cash paid to investors. Put the two pieces back together.
Two annual returns can average zero while the invested balance ends lower.
See why time changes the shape of growth—and what a smooth curve leaves out.
The difference between prices rising, prices falling, and prices rising more slowly.
Why losses and recoveries are unequal—and what that reveals about investment risk.
Why the number of investments matters less than what they have in common.
Follow two identical starting balances and see how ongoing costs change the outcome.
The payments stay fixed. The price adjusts. Explore the arithmetic behind a bond’s changing value.
Separate a growing account balance from a growing ability to buy things.
One balance. Three repayments. See how time adds to the cost of borrowing.
A company can report a profit while cash leaves the business. Follow one unpaid invoice.
A lower share price can belong to a much larger company. Count all the slices.
A fixed cash balance can buy less as prices rise. Move the sliders to explore the effect of a constant inflation rate.
Read the inflation lesson →An educational illustration. The balance earns no interest. Inflation is held constant; actual prices and personal spending patterns vary. AED is the display currency.
Enter a cash balance from 0 to 1,000,000,000.
25.6% less purchasing power after 10 years.
A basket costing AED 10,000 today would cost AED 13,439 then.
Today’s buying power = cash balance ÷ (1 + annual inflation rate)years. Future basket cost = today’s basket cost × (1 + annual inflation rate)years. Percentages use the rate as a decimal. Figures are rounded for display.
Change the starting amount, regular contributions, and rate in the compound growth explorer.
Educational explanations and hypothetical models, not personalised investment advice. Published 13 November 2026. Reference sources include the U.S. SEC, IMF, ECB, CFPB, SBA, FINRA and OpenStax; they do not endorse this site.

Fifty illustrated stories. New: industrial science, responsible sourcing, benchmarks, market activity, orders and options.
Explore the Silver collection →