
THE SILVER COLLECTION / CHAPTERS 01—05

Silver.
More than
a precious metal.

A gleam in the earth. A contact in a circuit. A fine line on a solar cell. Discover the metal that connects beauty, industry and value.

50 original posters50 companion articlesSources in every story
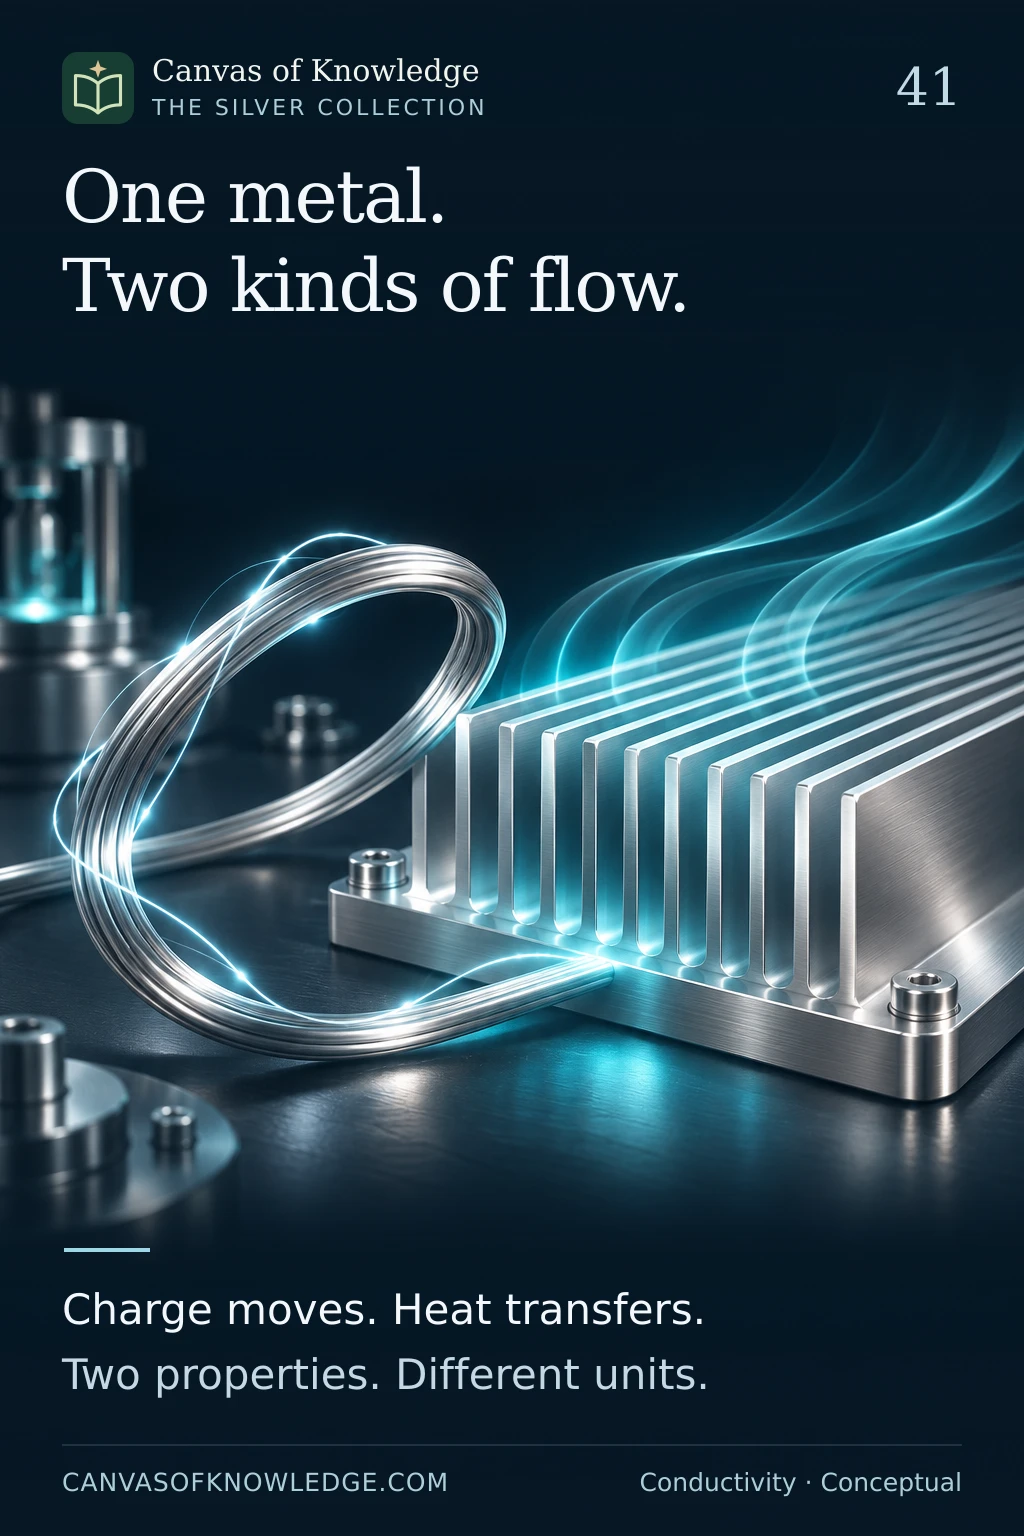
A silver wire loop beside polished heat-dissipation fins illustrates electrical and thermal conduction; the light trails are conceptual.
THE SILVER COLLECTION / 01—50

Fifty ways to see silver.

Five illustrated chapters, connecting the metal, its markets, practical ownership, industrial science and the details behind decisions. Open a poster, read the story, or follow the evidence.

50 illustrated
stories
CHAPTER 01 / 01—10

Silver essentials

The metal, its origins, its uses and the costs of ownership.

A silver crystal and ribbon illustrate the properties of element Ag, atomic number 47.View full infographic
01 / 50

The metal behind the shine

Ag · 47. A precious metal with a practical second life.

Read the infographic & sources

Silver. Quietly remarkable. Ag · Atomic number 47 Conductive. Reflective. Tarnishes.

Illustrative artwork. Element illustration is conceptual, not an atomic model. Industrial usefulness does not establish an investment return.
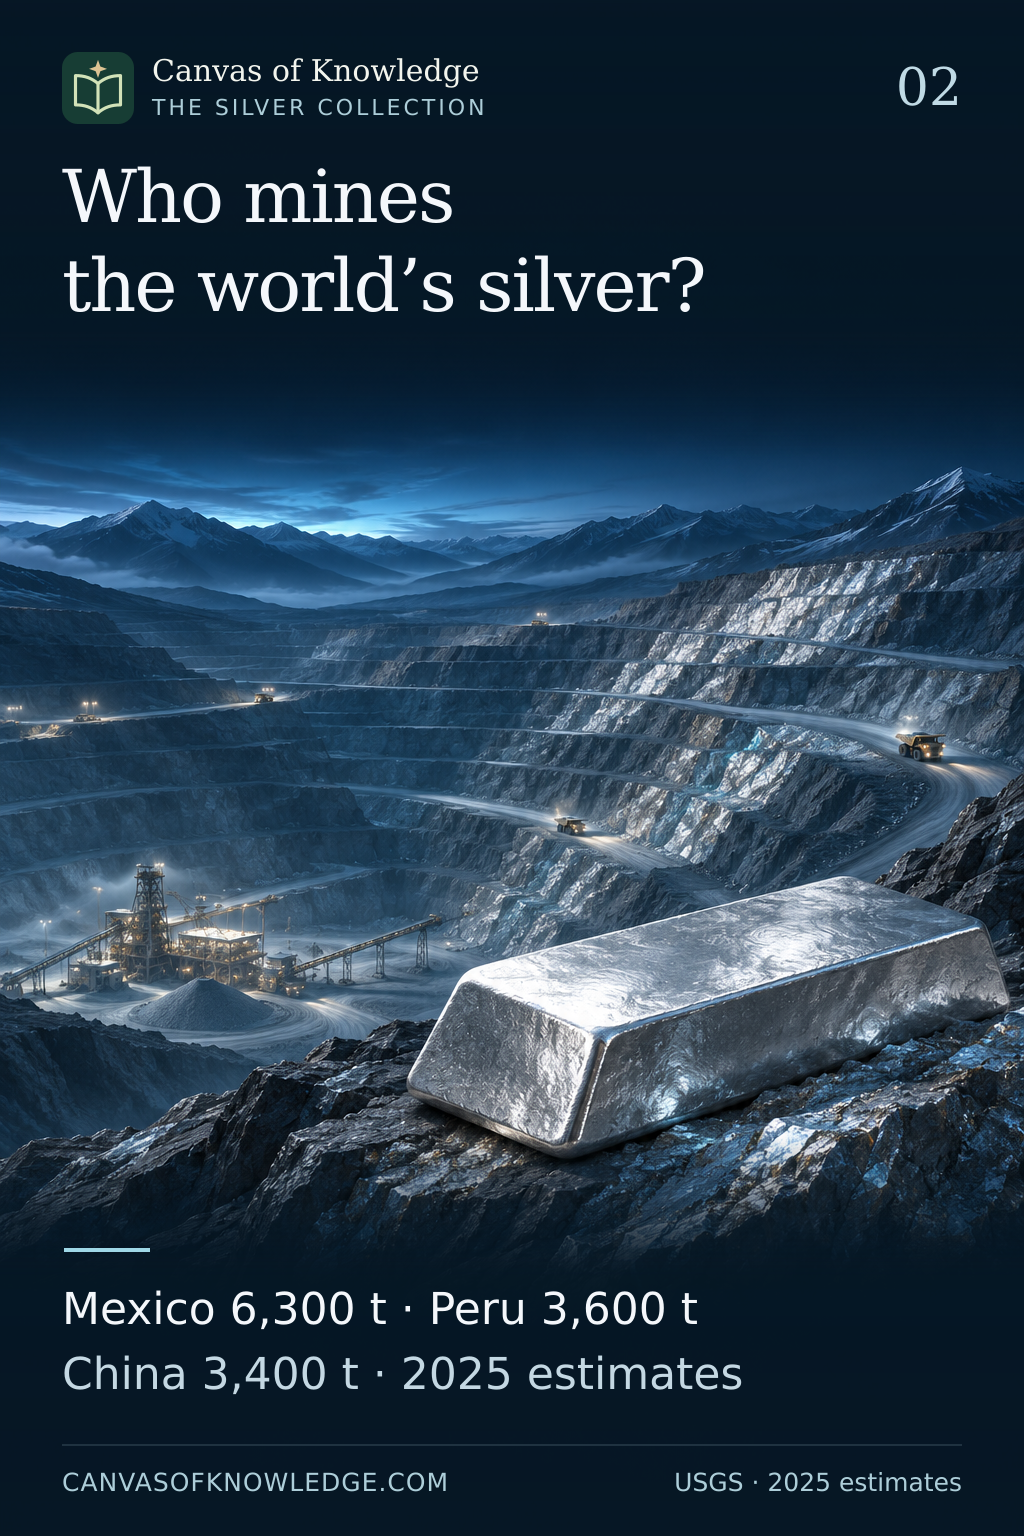

A conceptual open-pit mine accompanies 2025 silver mine-output estimates: Mexico 6,300 tonnes, Peru 3,600 and China 3,400.View full infographic
02 / 50

Where the world mines silver

Mexico leads. Peru and China follow. Read the units before the ranking.

Read the infographic & sources

Who mines the world’s silver? Mexico 6,300 t · Peru 3,600 t China 3,400 t · 2025 estimates

Illustrative artwork. 2025 estimates from USGS Mineral Commodity Summaries 2026. Metric tonnes of silver content; world total rounded. The approximately 51% combined share is calculated as 13,300 ÷ 26,000. Metric tonnes of silver content. Source: USGS Mineral Commodity Summaries 2026; 2025 estimates. The mine does not depict a specific location.
A composite ore specimen and small silver bead illustrate silver recovered with other metals.View full infographic
03 / 50

Silver's other mining story

A silver bar may begin in a mine built around another metal.

Read the infographic & sources

Silver’s hidden companions. Often recovered alongside lead, zinc, copper or gold.

Illustrative artwork. Conceptual supply-chain illustration. Routes vary by deposit and process; no production shares or immediate supply response are implied.

Fine silver-white contacts across a solar cell illustrate collection of electrical current.View full infographic
04 / 50

The silver inside a solar cell

Sunlight supplies the energy. Silver helps the current travel.

Read the infographic & sources

A fine line that carries power. Silver contacts collect current. The solar cell converts light.

Illustrative artwork. Simplified photovoltaic illustration, not to scale. Cell architectures and silver loadings vary; no fixed grams-per-panel figure is assumed.

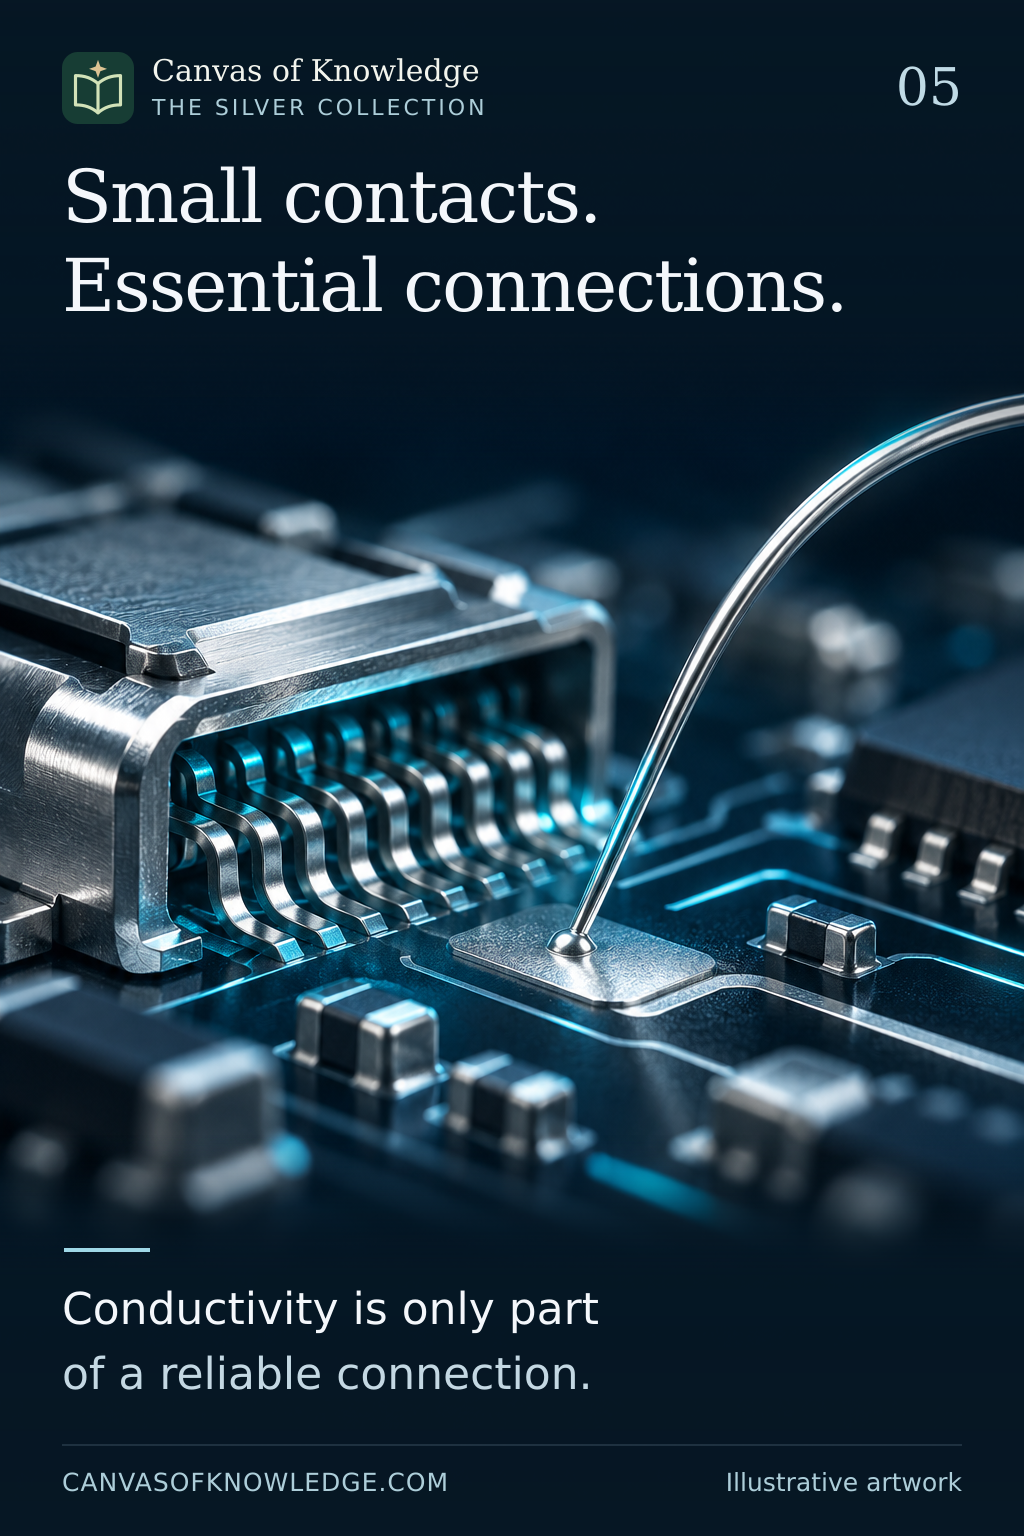
A silver wire and electronic contact illustrate the importance of conductivity and surface conditions.View full infographic
05 / 50

Small contacts. Important connections.

Silver's electronic role often sits at the point where current must cross.

Read the infographic & sources

Small contacts. Essential connections. Conductivity is only part of a reliable connection.

Illustrative artwork. Conceptual component illustration. Materials, coatings and silver content vary by product; no device loading or price forecast is implied.

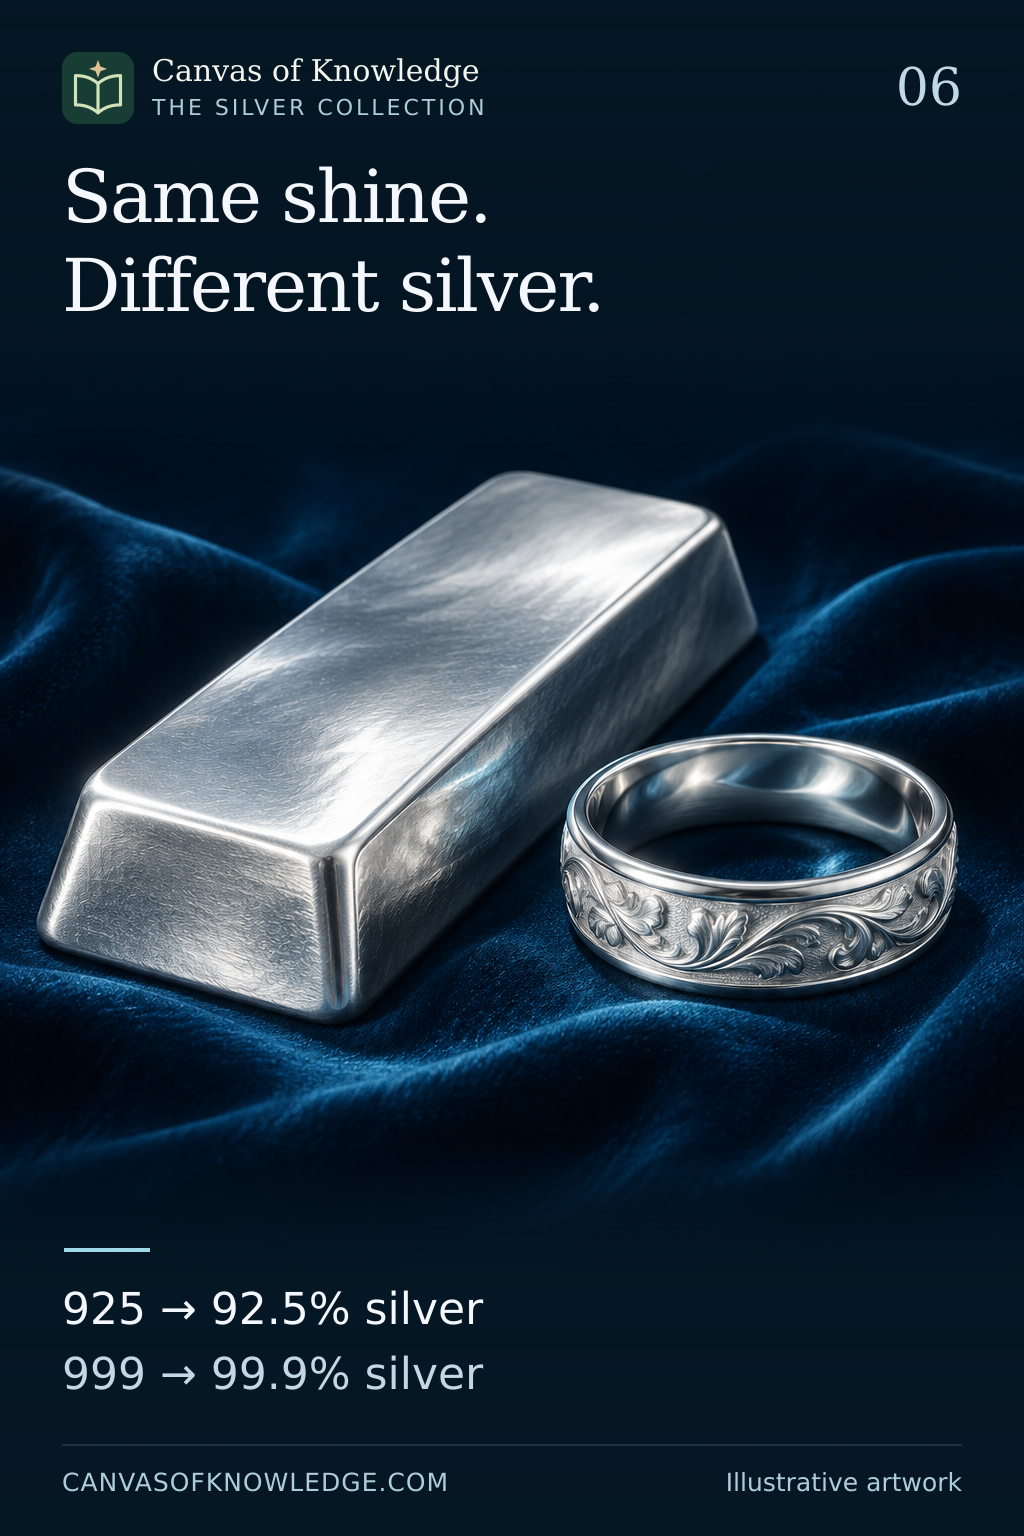
A silver bar and ring illustrate 925 fineness at 92.5 per cent and 999 at 99.9 per cent.View full infographic
06 / 50

Same shine. Different silver.

What 925 and 999 tell you about the metal inside.

Read the infographic & sources

Same shine. Different silver. 925 → 92.5% silver 999 → 99.9% silver

Illustrative artwork. The numerical examples assume the stated fineness exactly. Hallmarking requirements vary by jurisdiction.

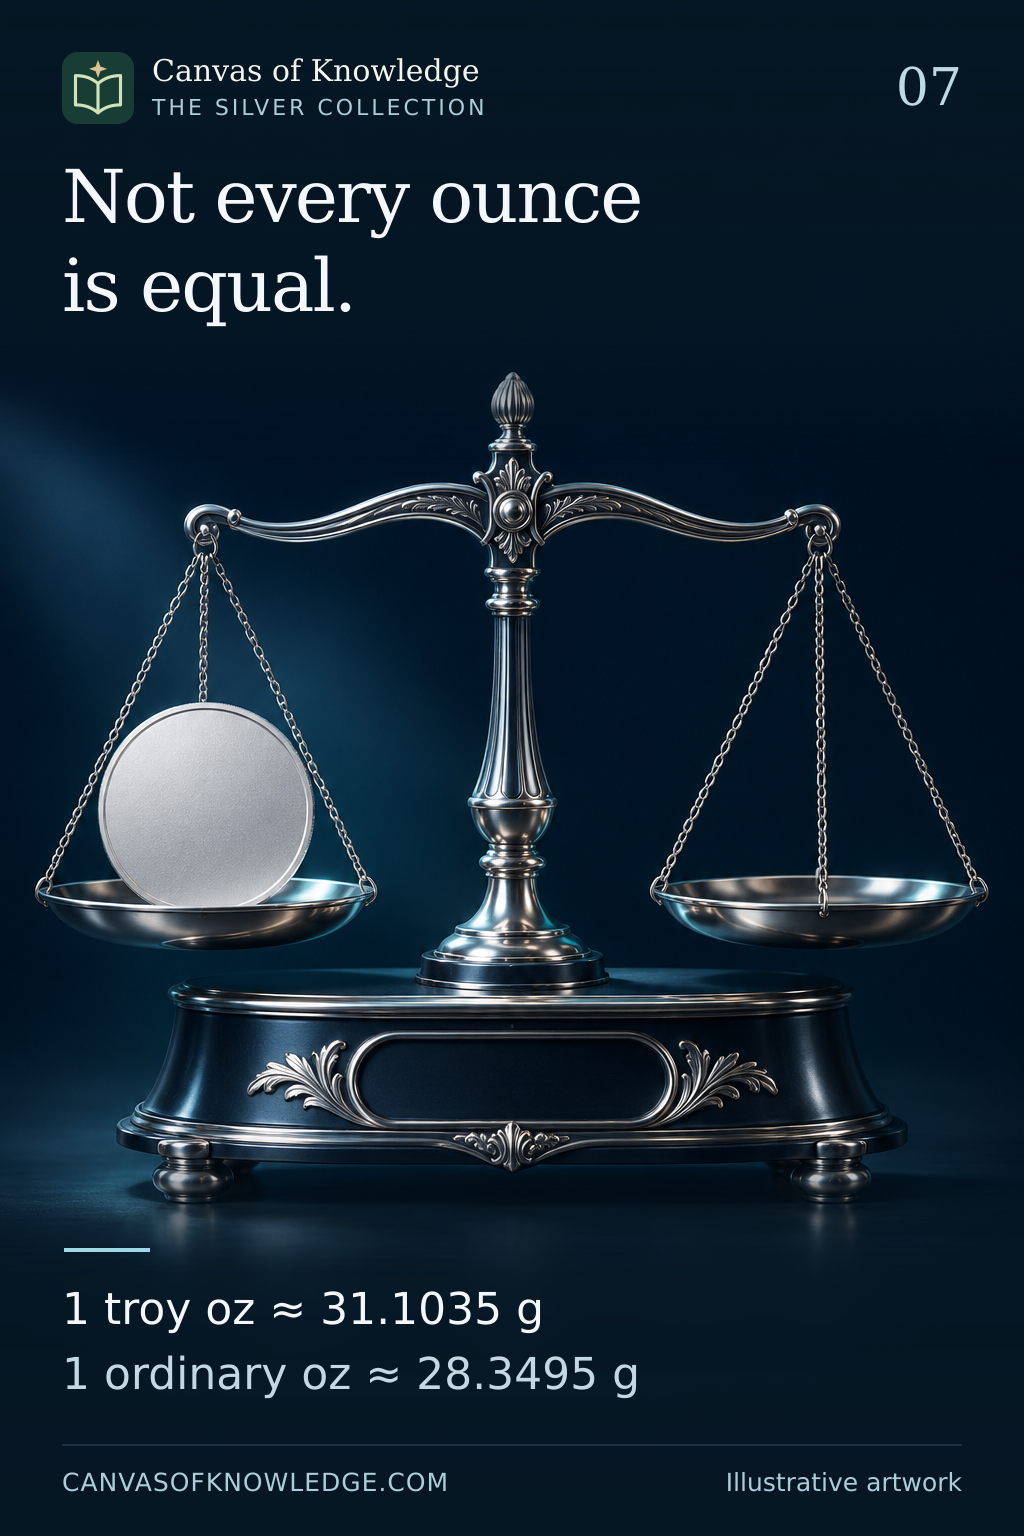
A blank silver round on a jeweller’s balance accompanies exact typeset troy and ordinary ounce conversions.View full infographic
07 / 50

Not every ounce is equal.

Silver uses a heavier ounce than the familiar everyday measure.

Read the infographic & sources

Not every ounce is equal. 1 troy oz ≈ 31.1035 g 1 ordinary oz ≈ 28.3495 g

Illustrative artwork. The ounce definitions are exact. Displayed conversions and percentages are rounded; the purity example is hypothetical.

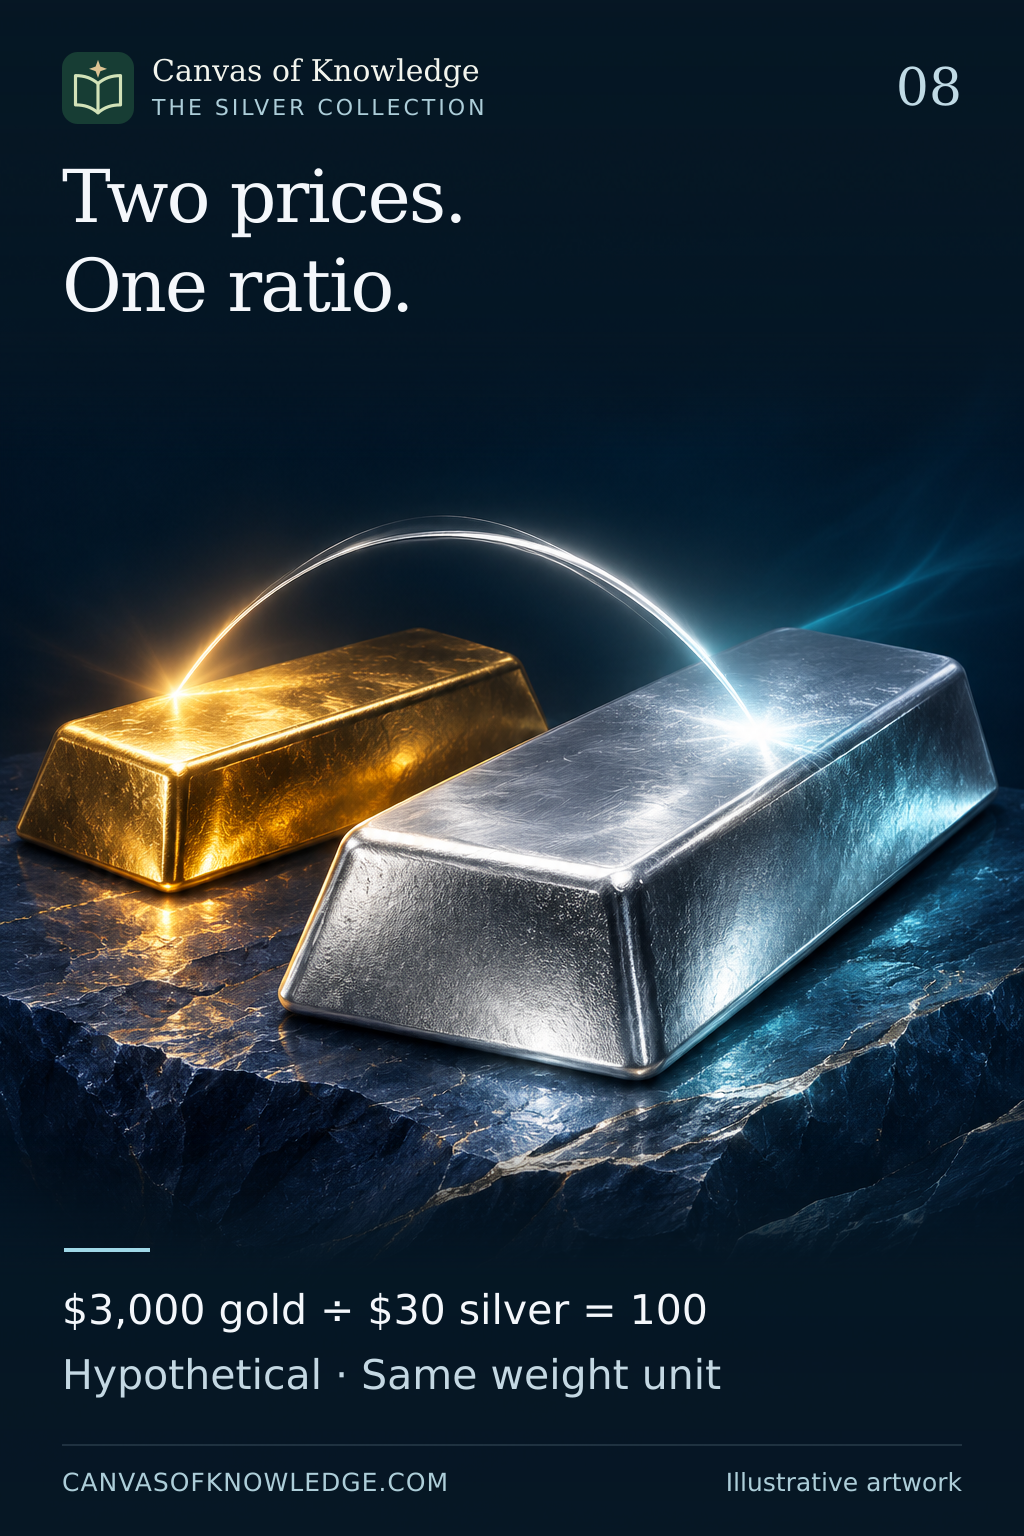
Gold and silver bars accompany the hypothetical calculation 3,000 divided by 30 equals 100.View full infographic
08 / 50

Two prices. One ratio.

The gold–silver ratio is a comparison, not a verdict on value.

Read the infographic & sources

Two prices. One ratio. $3,000 gold ÷ $30 silver = 100 Hypothetical · Same weight unit

Illustrative artwork. All prices and ratios in the examples are hypothetical. This is an explanation of a measurement, not a trading signal.

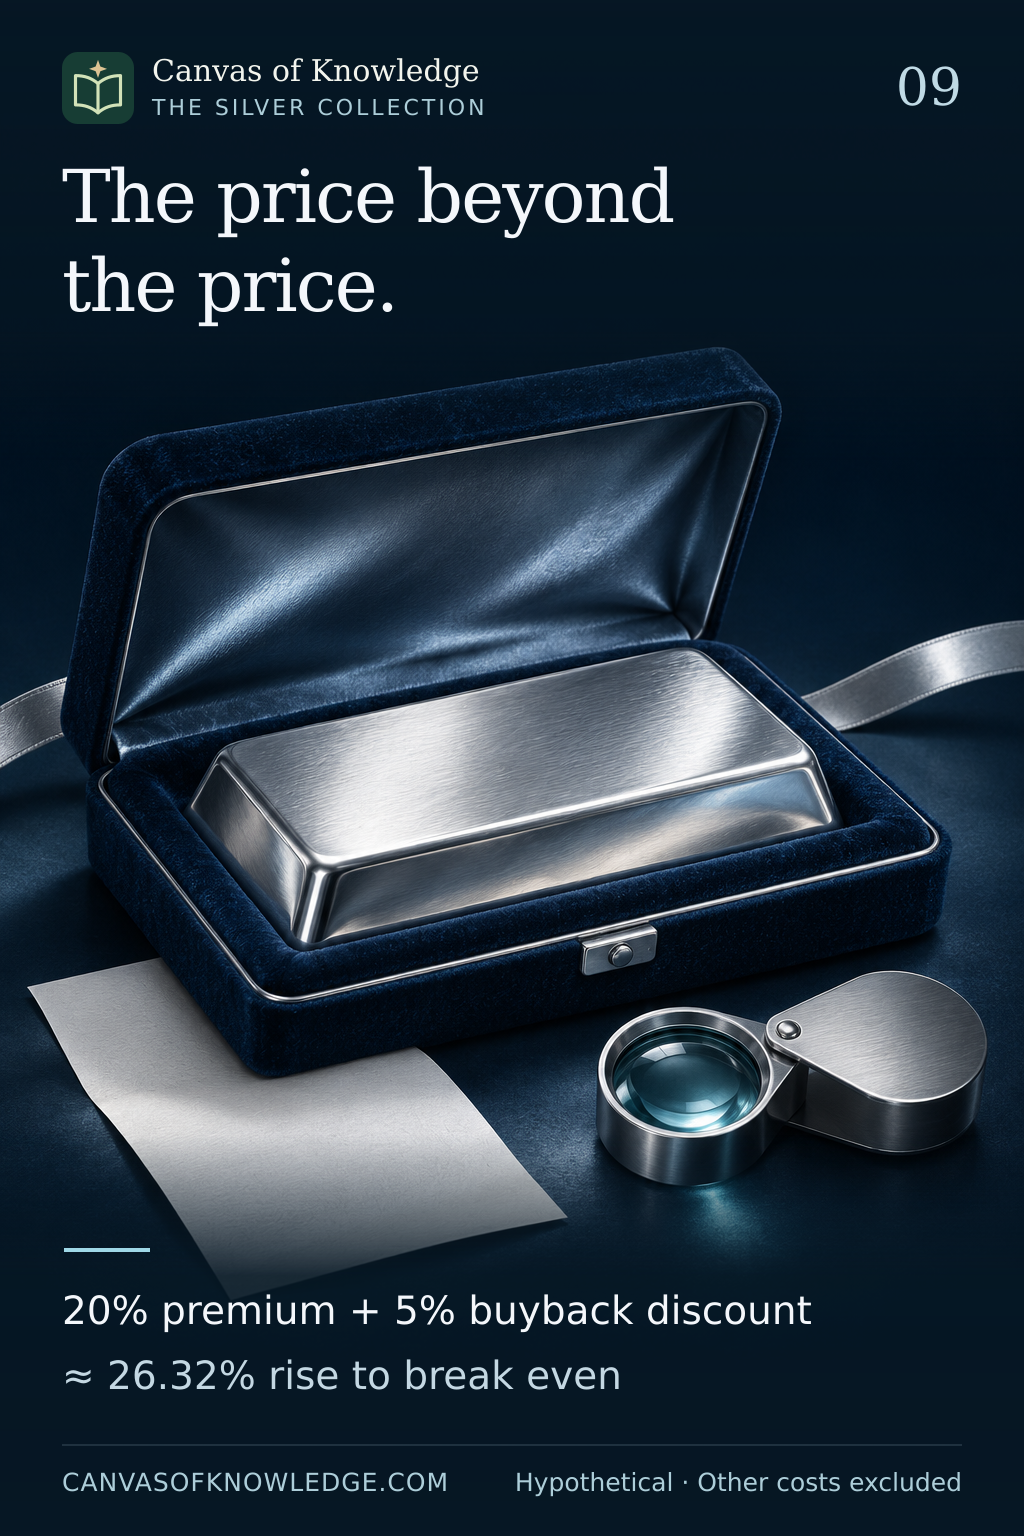
A silver bar in a presentation case accompanies a hypothetical break-even calculation with a 20 per cent premium and 5 per cent resale discount.View full infographic
09 / 50

Silver rises. Have you broken even?

The gap between buying and selling can be wider than the price chart suggests.

Read the infographic & sources

The price beyond the price. 20% premium + 5% buyback discount ≈ 26.32% rise to break even

Illustrative artwork. Hypothetical example: 20% premium, 5% resale discount, constant terms and no other costs. The required spot-price rise is approximately 26.3158%. Other costs excluded.

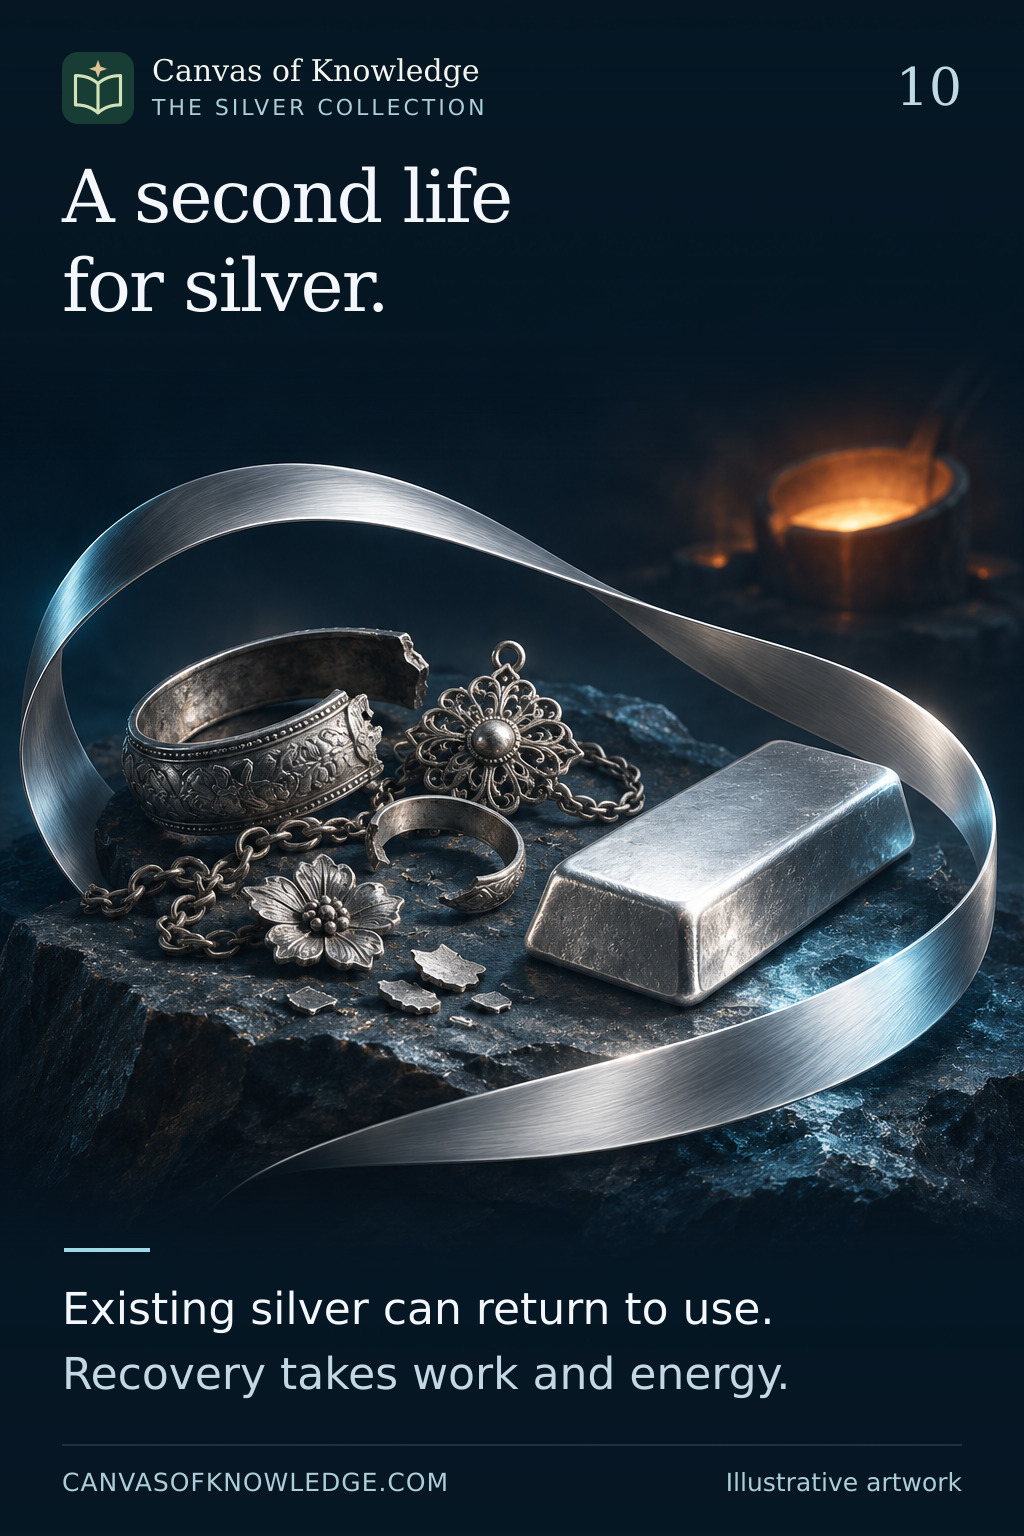
A loop of silver around used jewellery and a refined bar illustrates recovery and reuse.View full infographic
10 / 50

A second life for silver.

Recoverable metal still needs a route back into use.

Read the infographic & sources

A second life for silver. Existing silver can return to use. Recovery takes work and energy.

Illustrative artwork. This explanation describes recycling pathways. It does not assume complete recovery or claim that any particular process has zero environmental impact.

CHAPTER 02 / 11—20

Silver, money & markets

History, hidden technology and the mechanics behind the market.

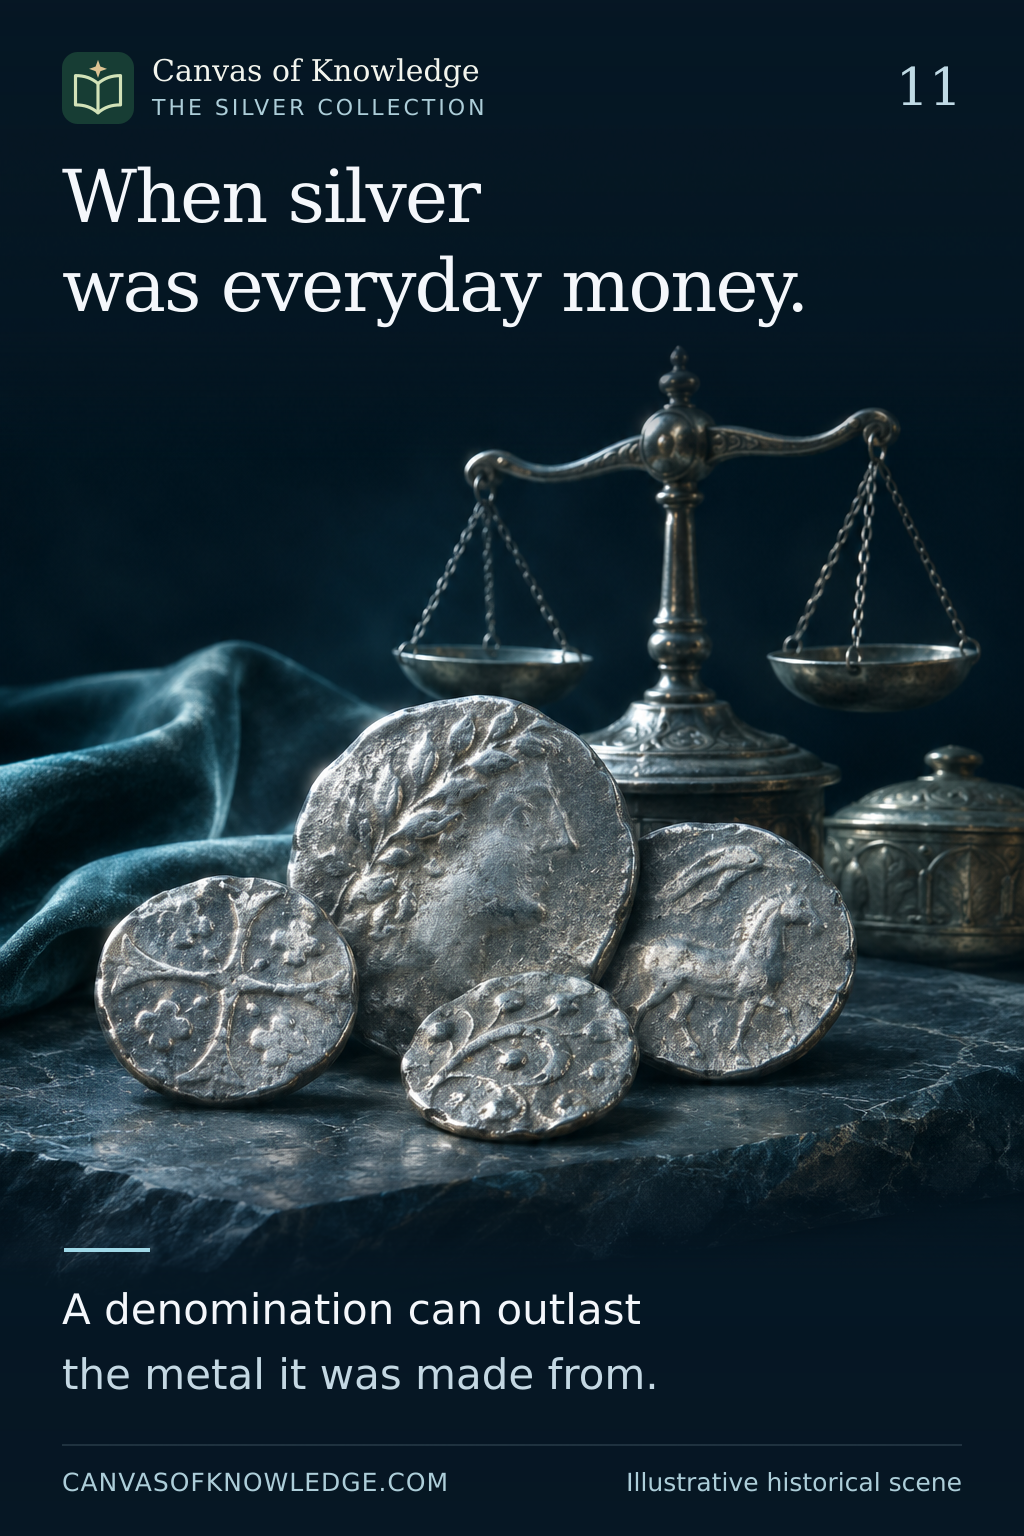
Silver coins and an antique balance illustrate the history of silver as money. The coins are imagined, not identified historical artefacts.View full infographic
11 / 50

When silver was everyday money

A small silver penny connects centuries of English monetary history.

Read the infographic & sources

When silver was everyday money. A denomination can outlast the metal it was made from.

Illustrative artwork. This article concerns English and British coinage; monetary histories differ across countries.

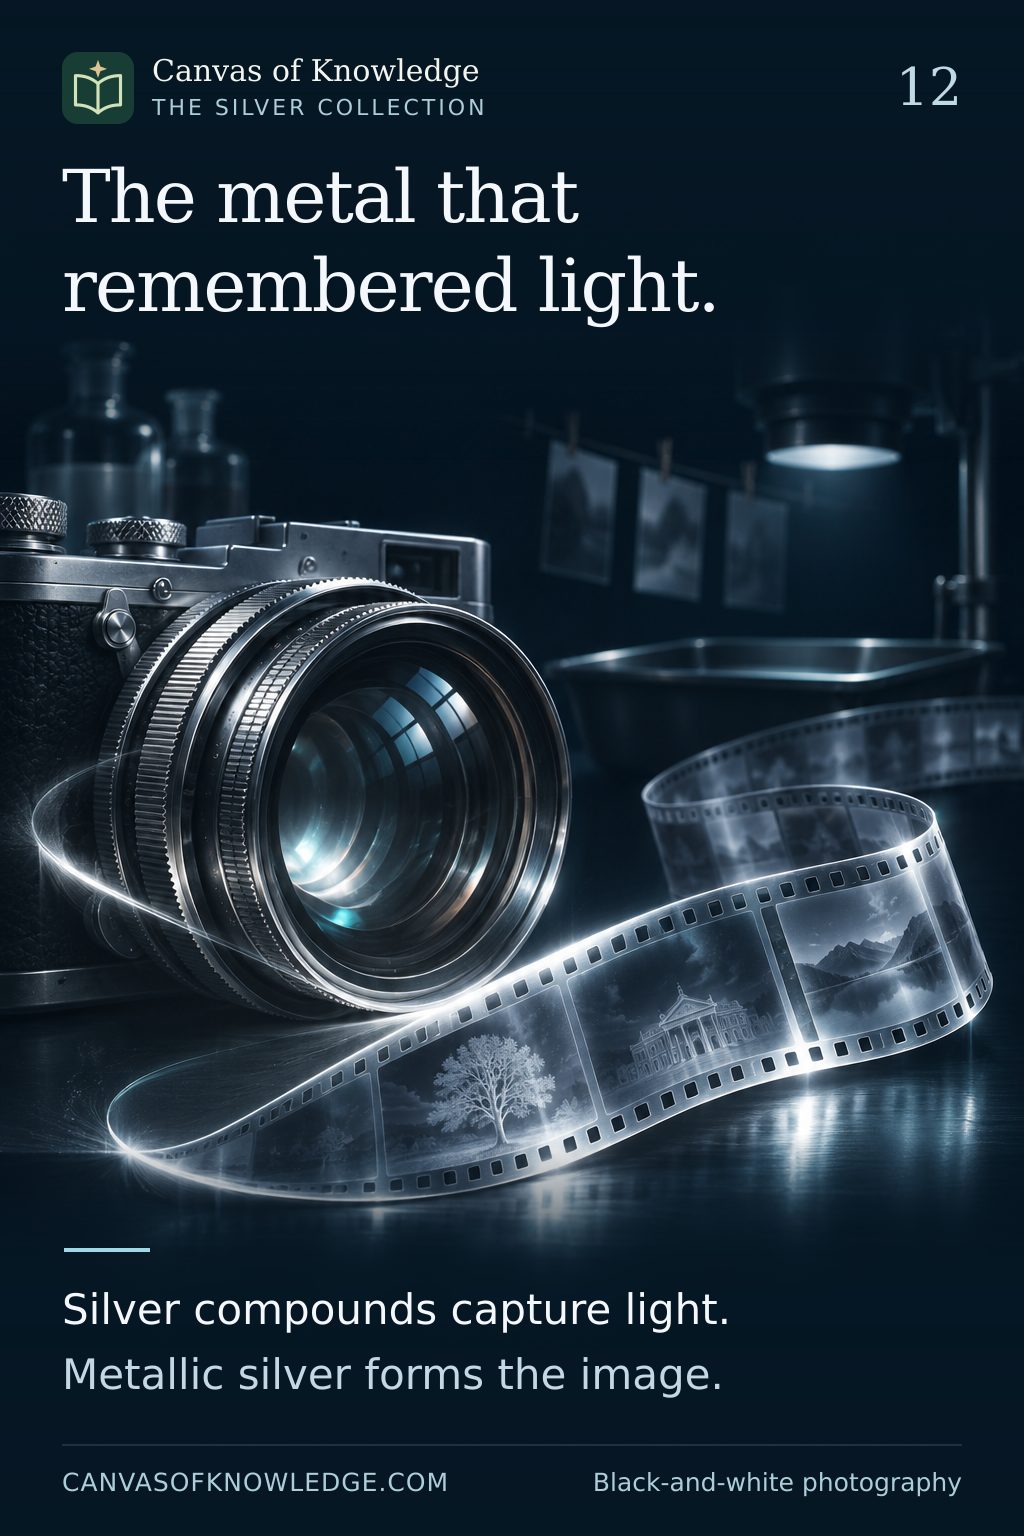
A vintage camera and film illustrate the silver chemistry of traditional black-and-white photography.View full infographic
12 / 50

How silver helped capture light

In traditional photography, light begins a chemical change that becomes an image.

Read the infographic & sources

The metal that remembered light. Silver compounds capture light. Metallic silver forms the image.

Illustrative artwork. This simplified account describes silver-based black-and-white processes; colour and historic processes have additional variations.

A curved mirror catches a beam of light, illustrating silver as a reflective coating, not an exact optical diagram.View full infographic
13 / 50

The thin silver behind a reflection

A precision mirror is a designed surface, not simply a solid piece of metal.

Read the infographic & sources

A thin layer. A brilliant reflection. Silver coatings reflect light. Protective layers help it last.

Illustrative artwork. The LIGO figure is an example from a particular technical specification, not a universal value for silver mirrors.

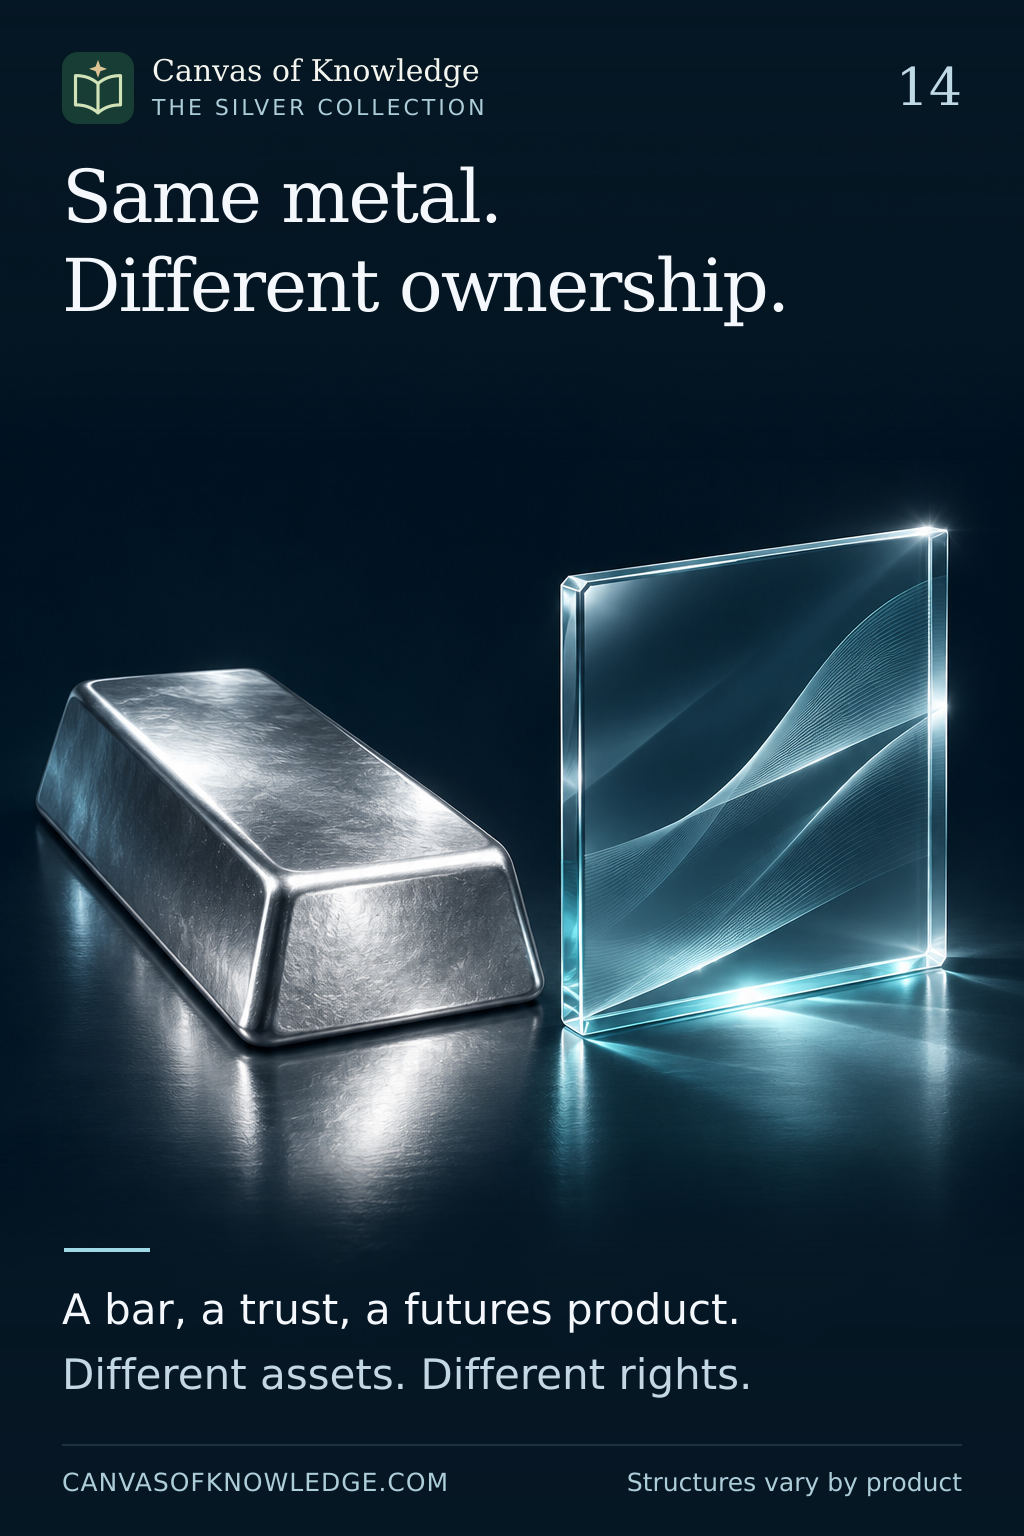
A silver bar and a transparent document form illustrate the distinction between physical metal and financial exposure.View full infographic
14 / 50

One metal, different ways to hold exposure

Physical silver and exchange-traded products create different ownership arrangements.

Read the infographic & sources

Same metal. Different ownership. A bar, a trust, a futures product. Different assets. Different rights.

Illustrative artwork. Educational comparison using US regulatory categories and one issuer example; product structures and rules vary by jurisdiction. This is not investment advice or a recommendation.

Silver forms on two planes and an hourglass illustrate the different settlement horizons of spot and futures.View full infographic
15 / 50

Why silver has more than one price

Spot and futures quotations answer different questions about timing and delivery.

Read the infographic & sources

One metal. More than one price. Spot and futures differ in timing. Compare like settlement terms.

Illustrative artwork. No live prices are shown. This is an explanation of market terminology, not a trading recommendation.

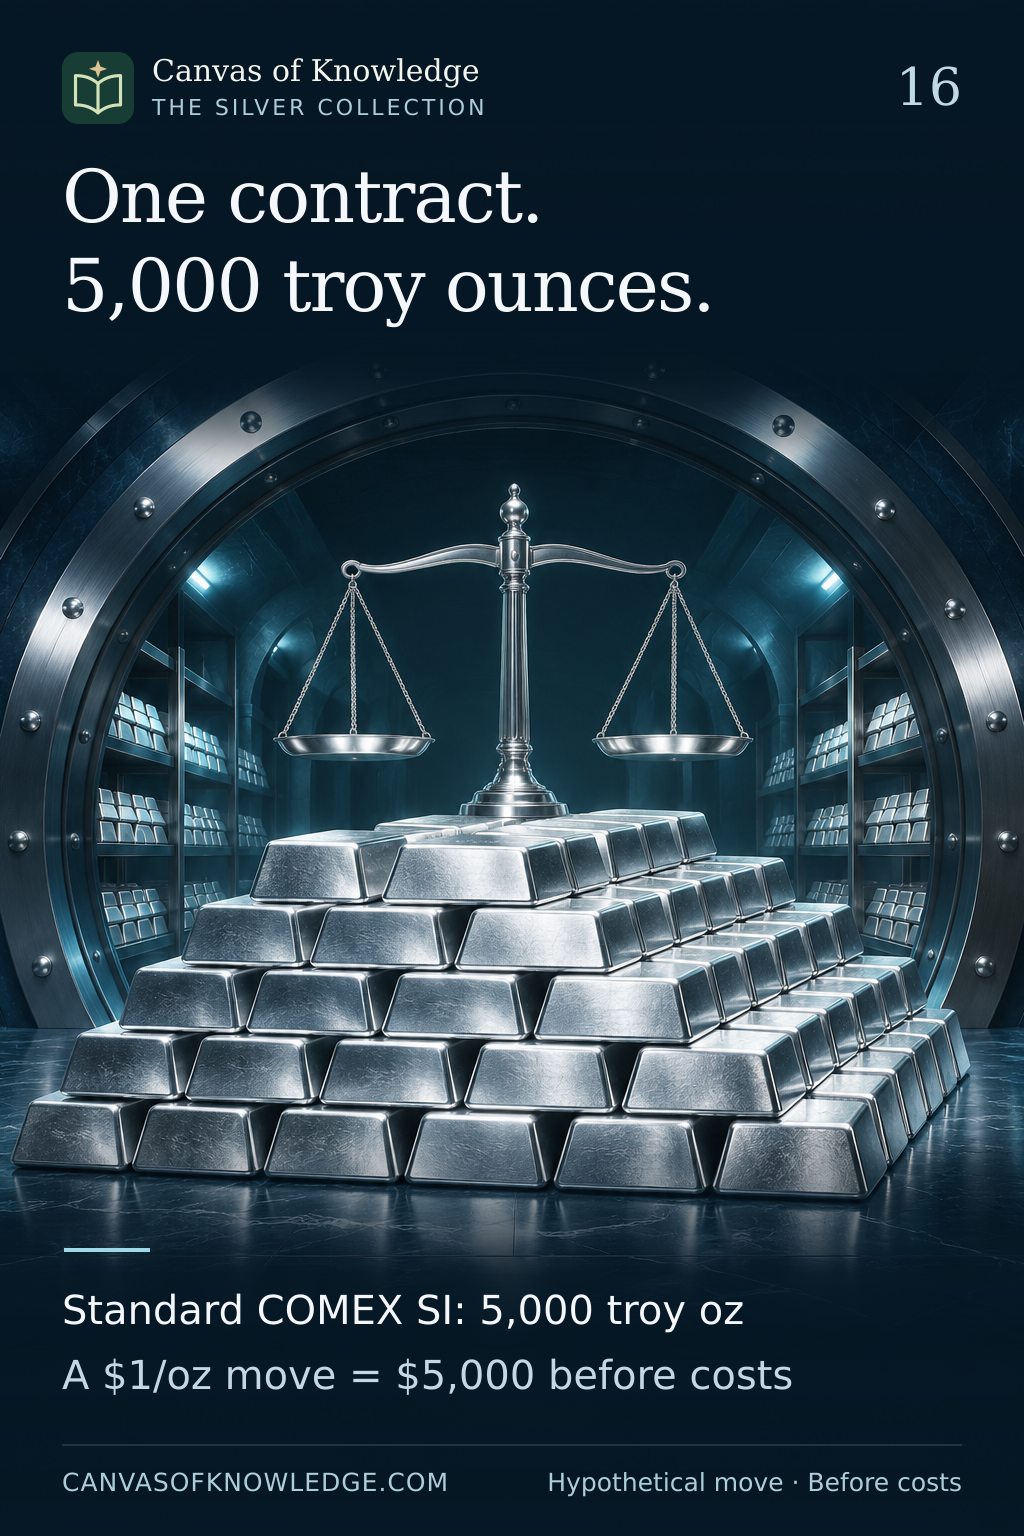
An illustrative vault stack accompanies the standard COMEX SI contract size of 5,000 troy ounces and a hypothetical $5,000 change for a $1-per-ounce move.View full infographic
16 / 50

One contract, 5,000 ounces

How the standard COMEX Silver futures multiplier turns a price move into a dollar amount.

Read the infographic & sources

One contract. 5,000 troy ounces. Standard COMEX SI: 5,000 troy oz A $1/oz move = $5,000 before costs

Illustrative artwork. Hypothetical US-dollar example. Standard COMEX Silver contract specifications checked against CME Rulebook Chapter 112 on 14 November 2026; other silver products have different specifications.

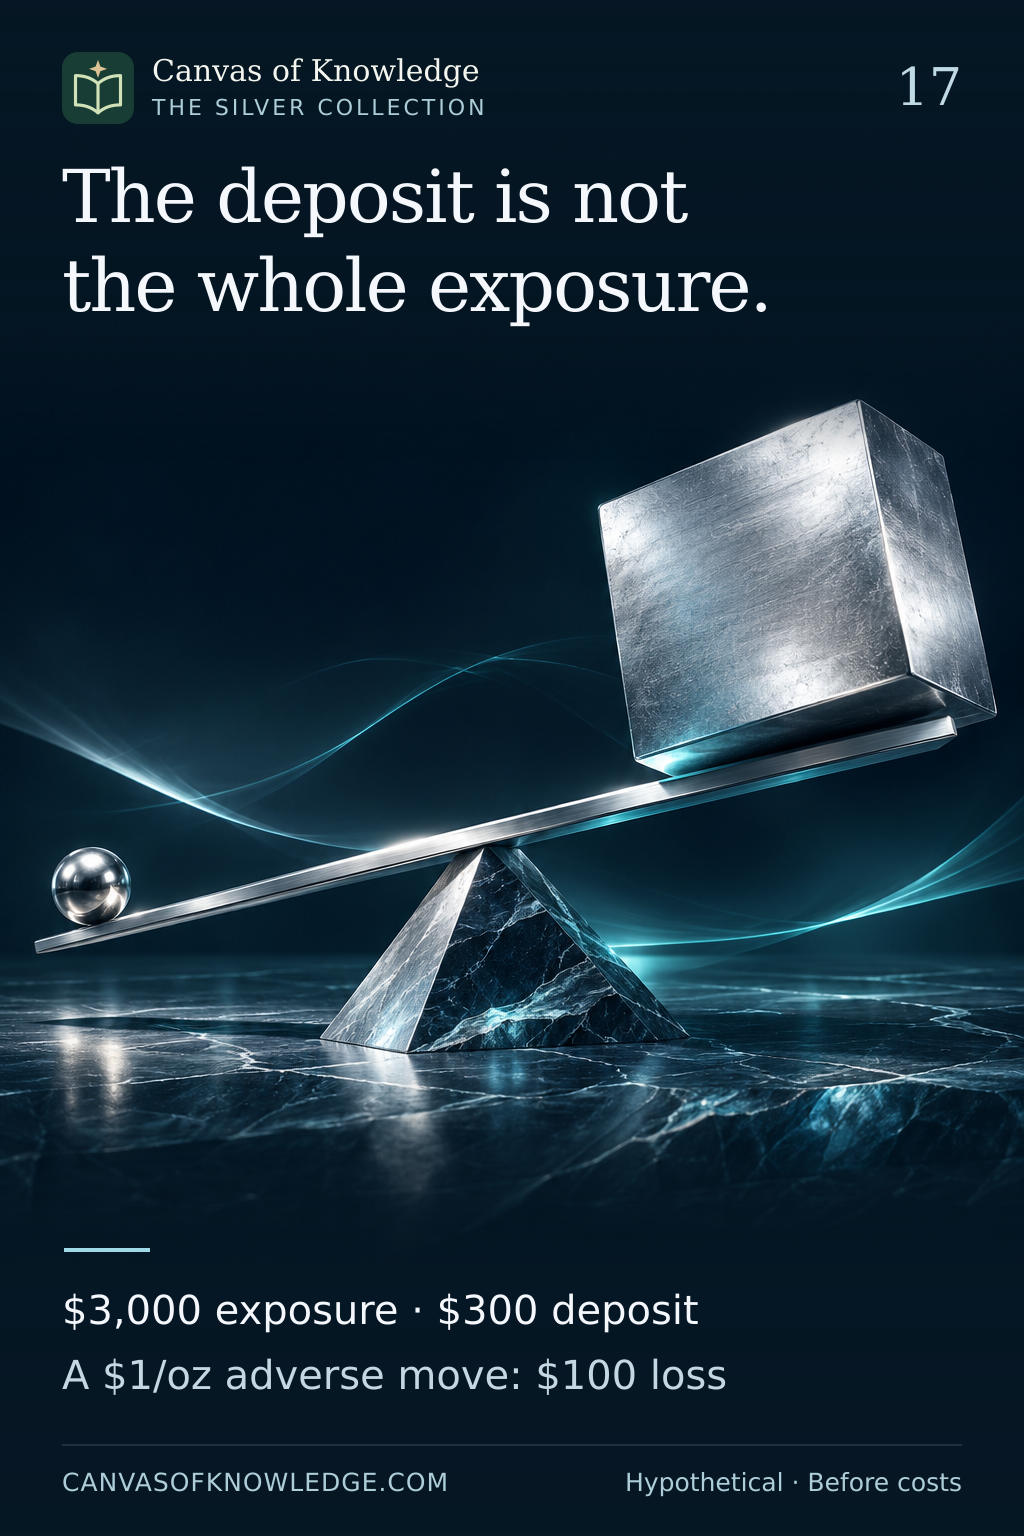
A sculptural lever illustrates hypothetical $3,000 exposure supported by a $300 deposit, with a $100 loss for a $1-per-ounce adverse move.View full infographic
17 / 50

Margin is smaller than exposure

A deposit supports the position; the full quantity determines its price sensitivity.

Read the infographic & sources

The deposit is not the whole exposure. $3,000 exposure · $300 deposit A $1/oz adverse move: $100 loss

Illustrative artwork. All prices, position sizes and the $300 deposit are hypothetical teaching assumptions, not current margin requirements. Calculations exclude fees, financing and other costs. The lever is a visual metaphor, not a scale drawing.

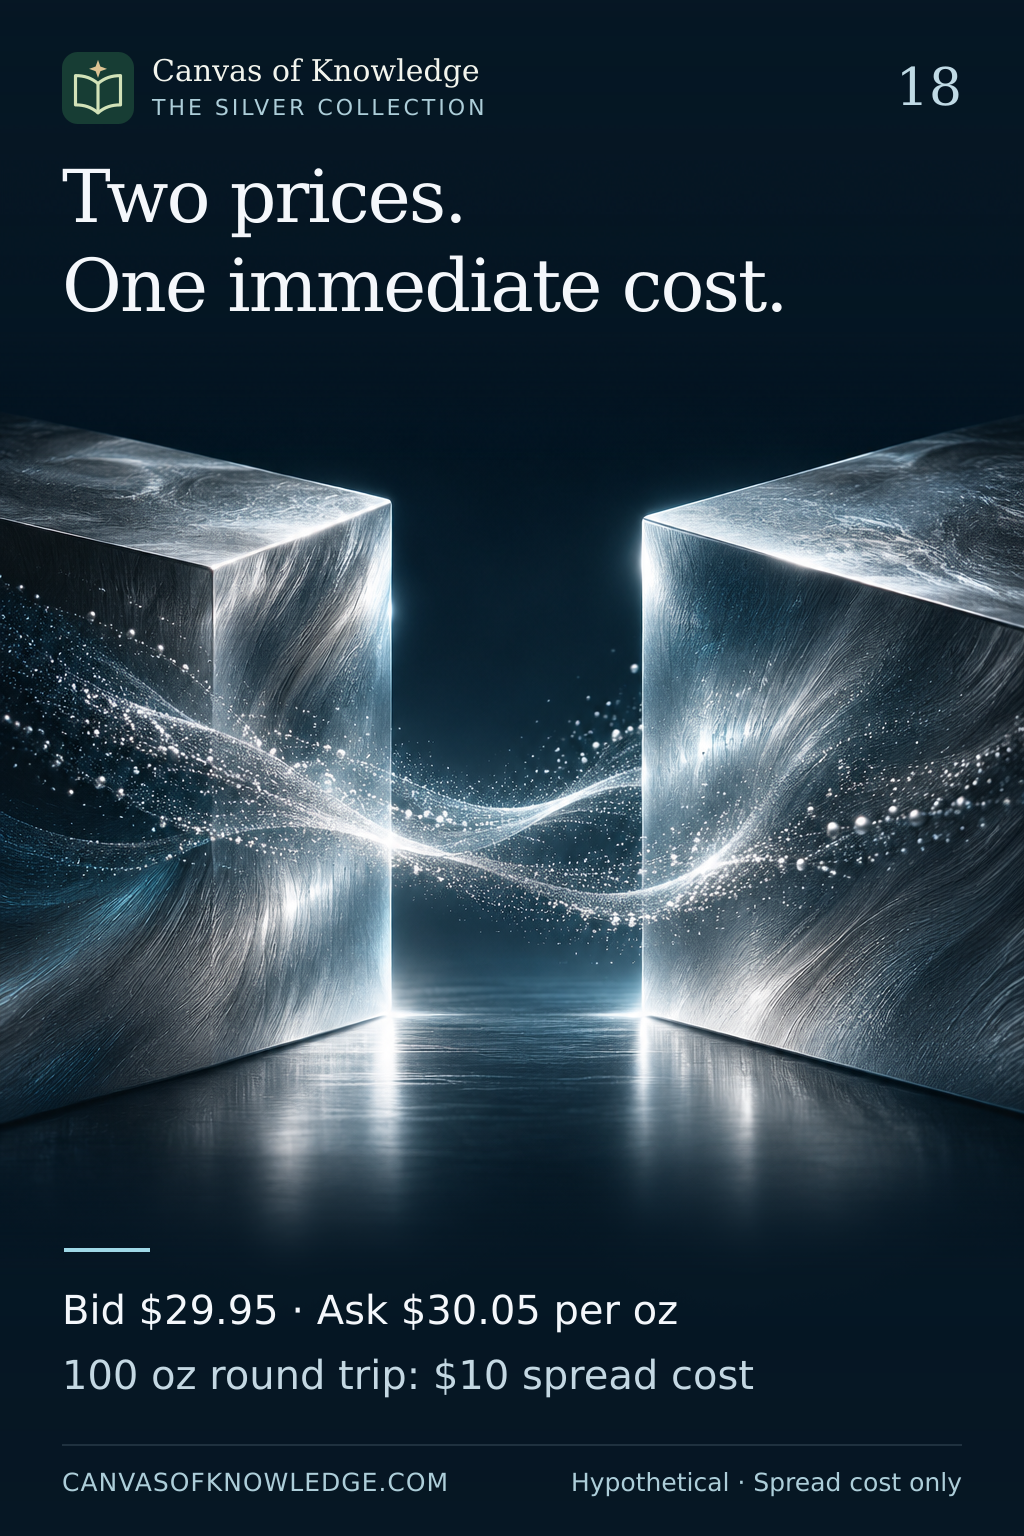
Two silver blocks separated by a gap illustrate a bid-ask spread, with hypothetical $29.95 and $30.05 quotes and a $10 spread cost for a 100-ounce round trip.View full infographic
18 / 50

Liquidity and volatility differ

Price movement and ease of execution describe different features of a market.

Read the infographic & sources

Two prices. One immediate cost. Bid $29.95 · Ask $30.05 per oz 100 oz round trip: $10 spread cost

Illustrative artwork. The two quotes and 100-ounce quantity are hypothetical and do not describe a specific contract or live market. The $10 round-trip calculation assumes unchanged quotes and sufficient quantity at each price. Commissions and other transaction costs are excluded.

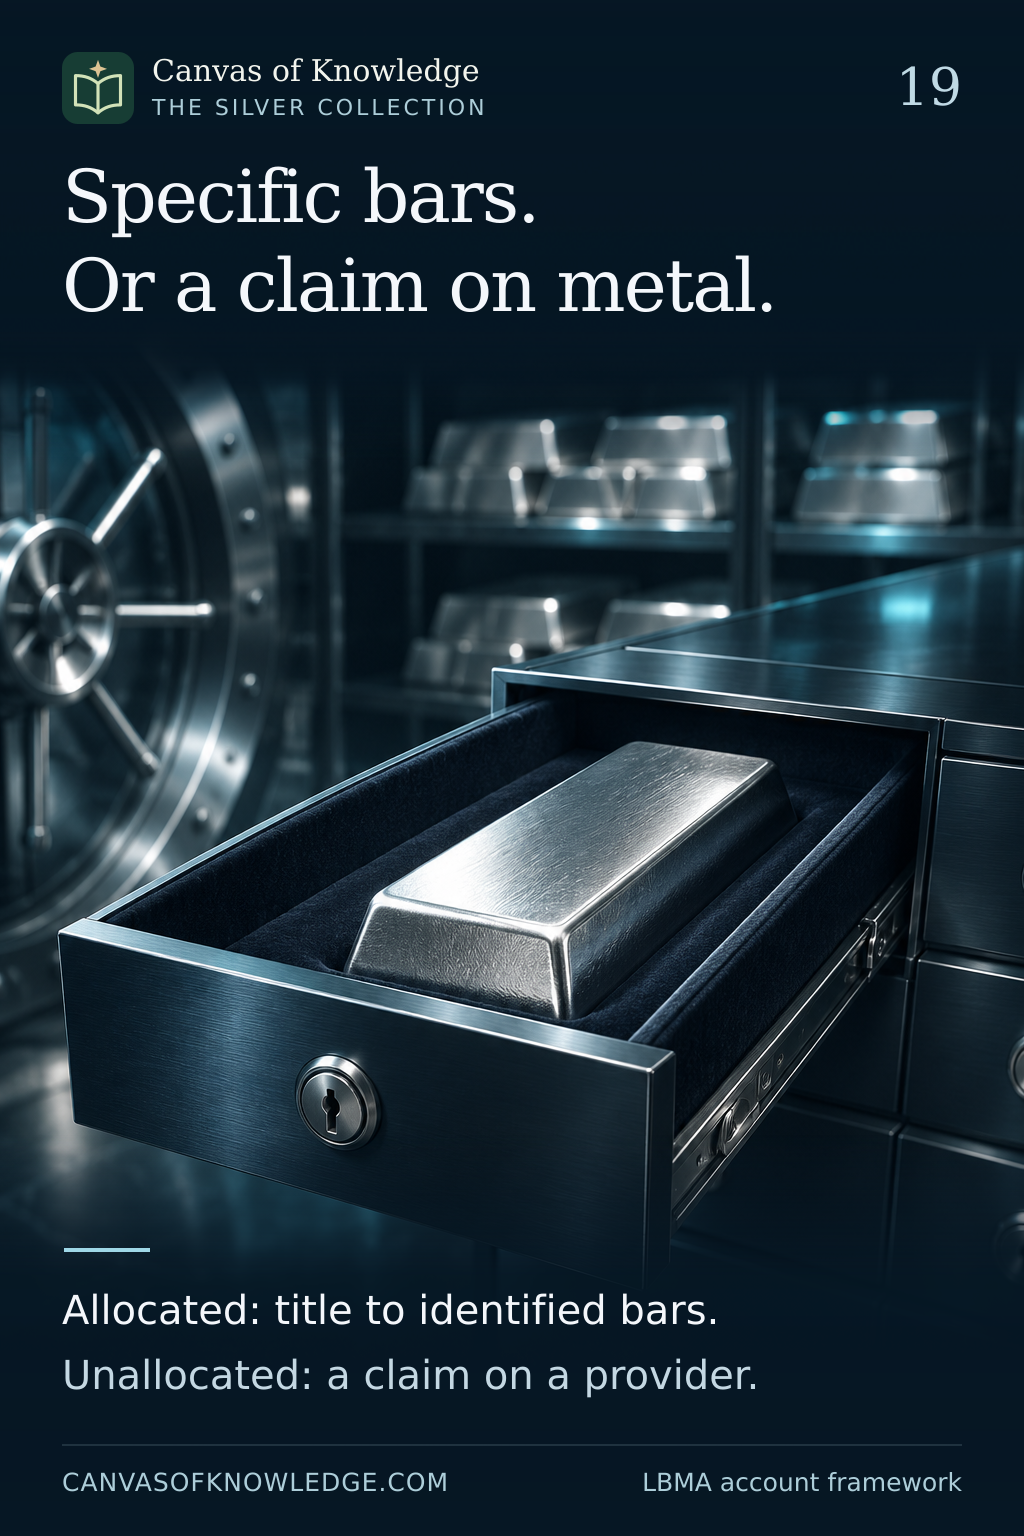
A separate bar in a vault drawer illustrates allocated ownership, contrasted in the caption with an unallocated claim on a provider.View full infographic
19 / 50

What does the account own?

Allocated and unallocated accounts create different claims on precious metal.

Read the infographic & sources

Specific bars. Or a claim on metal. Allocated: title to identified bars. Unallocated: a claim on a provider.

Illustrative artwork. This describes LBMA's wholesale precious-metal account framework, including silver. Product labels alone do not establish the rights, insurance or access terms of a particular arrangement.

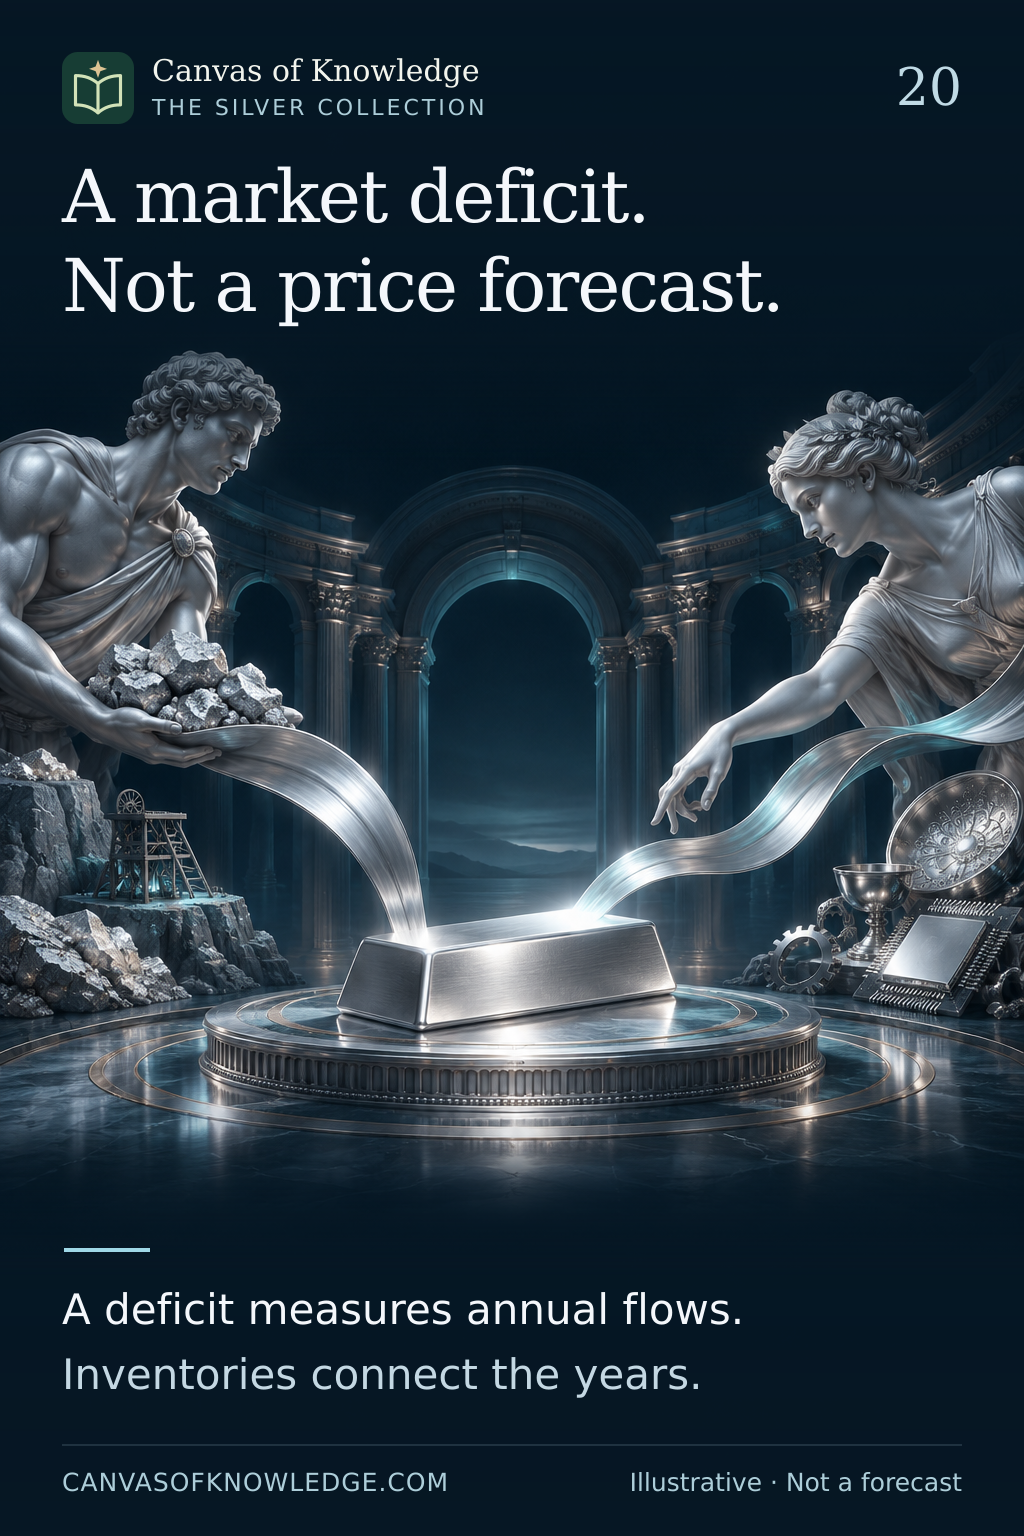
Two sculptural silver flows approach a bar, illustrating supply and demand accounting without representing quantities.View full infographic
20 / 50

A deficit is a flow measure

Supply-and-demand tables need inventory, definitions and market context.

Read the infographic & sources

A market deficit. Not a price forecast. A deficit measures annual flows. Inventories connect the years.

Illustrative artwork. No current supply, demand or price forecast is presented. The 2025 and 2026 publications are used to explain accounting and inventory concepts; published estimates and forecasts are distinct.

CHAPTER 03 / 21—30

Silver in practice

Buying, keeping, recovering and sizing exposure to the metal.

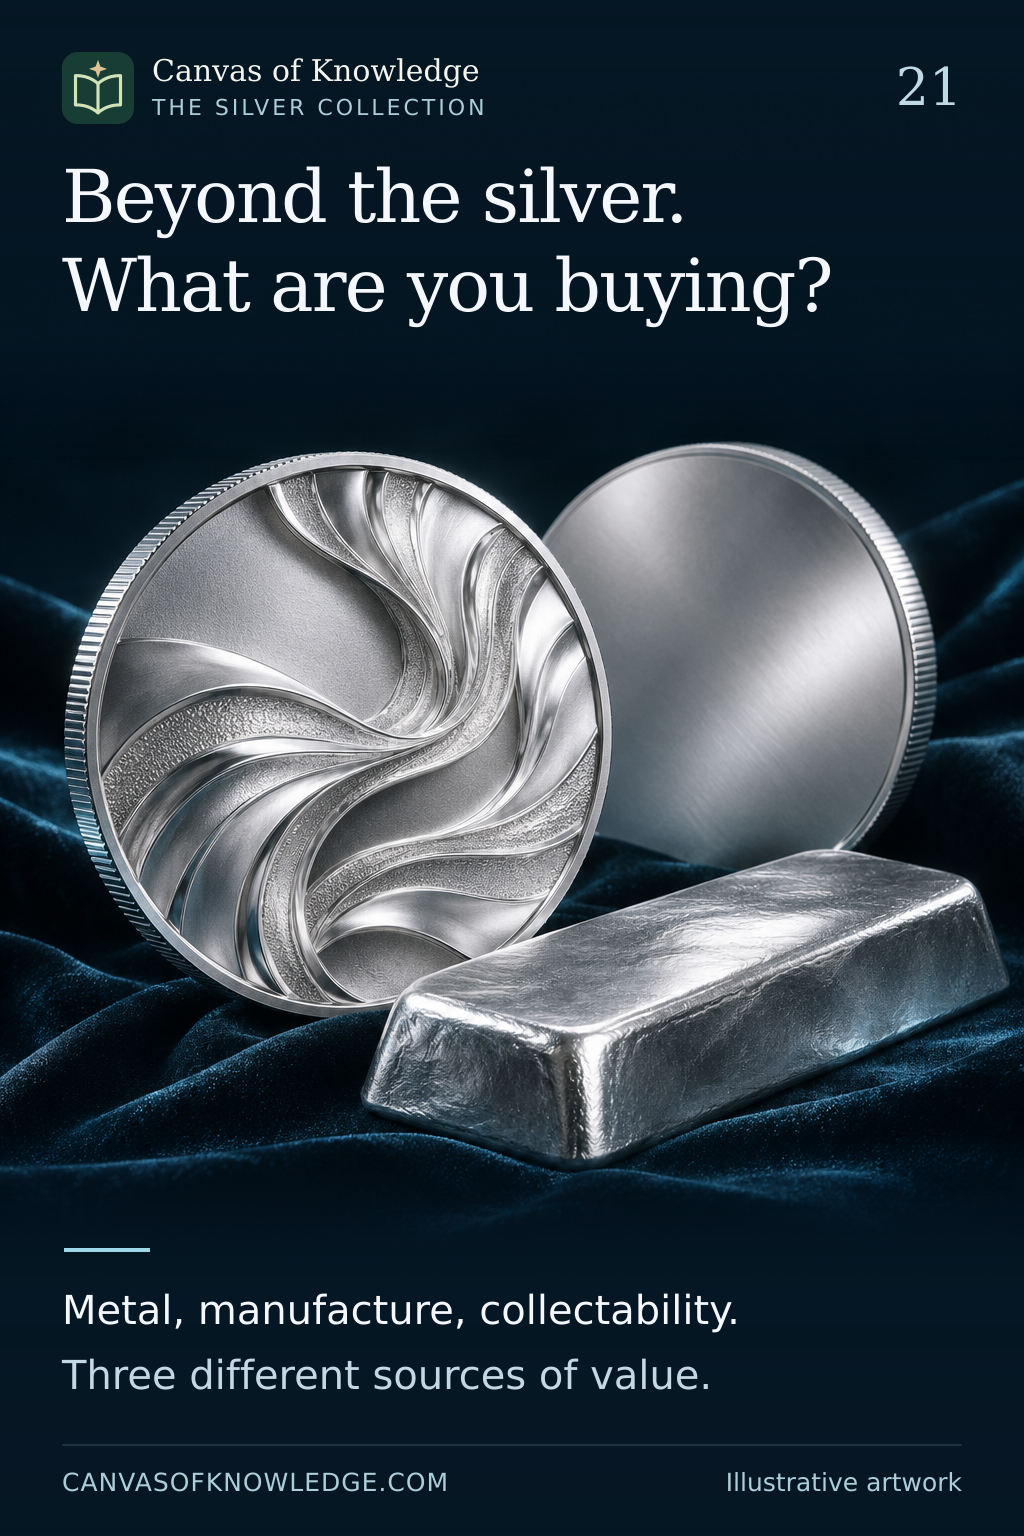
A silver coin, a private round and a cast bar in a conceptual still life. Their designs do not represent specific products.View full infographic
21 / 50

Three objects. Different reasons for value.

A bullion coin, a private round and a collectible may contain similar silver but trade on different terms.

Read the infographic & sources

Beyond the silver. What are you buying? Metal, manufacture, collectability. Three different sources of value.

Product categories and legal-tender rules vary by jurisdiction. This is an educational comparison, not an endorsement of a dealer or product.

A silver bar beside an optical inspection lens and a laboratory instrument illustrates authentication. The scene is conceptual, not a testing procedure.View full infographic
22 / 50

A silver stamp is a starting point.

Authentication combines provenance, measurements and appropriate testing; no casual visual check tells the whole story.

Read the infographic & sources

Beyond the stamp. Verify the silver. A surface test has limits. Provenance and assay work together.

UK hallmarking is used as an example. Exemptions and rules differ by item and country; this is not a legal checklist or a do-it-yourself testing guide.

A silver spoon with a subtle surface patina in a protective display, illustrating careful preservation.View full infographic
23 / 50

Tarnish changes the surface story.

Silver can lose its bright appearance without ceasing to be silver; careless cleaning can create a different problem.

Read the infographic & sources

Protect the surface. Preserve the story. Tarnish is a surface reaction. Repeated polishing can remove silver.

General conservation principles only. Storage and treatment should match the specific object; no chemical cleaning procedure is recommended here.

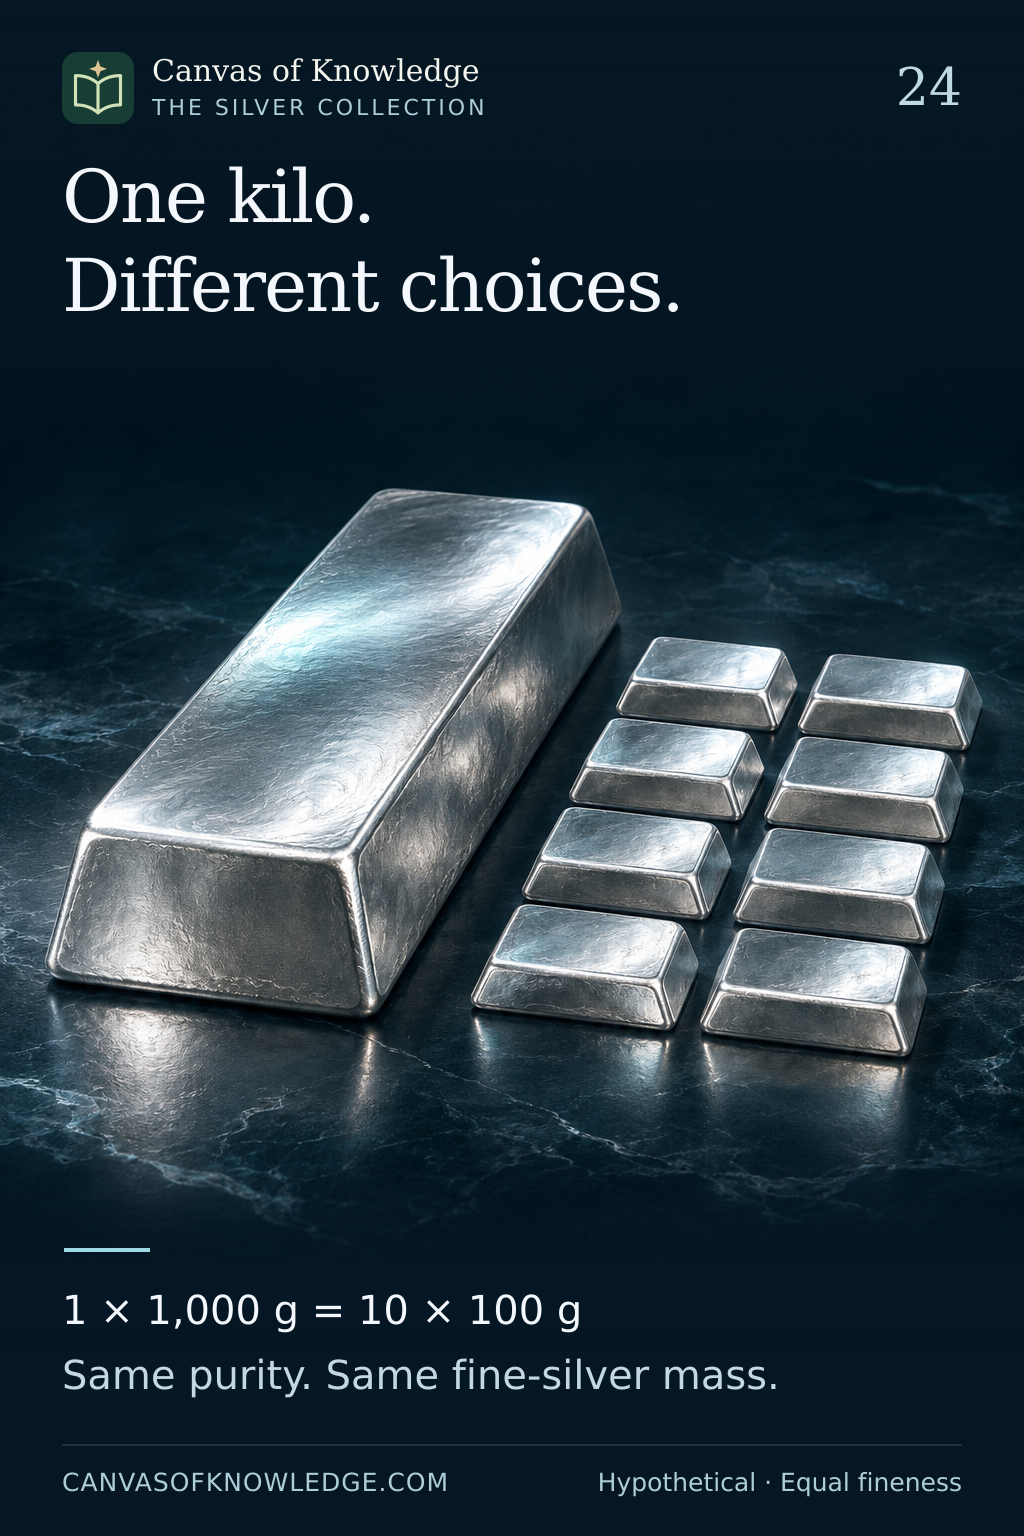
One large silver bar and a group of smaller silver bars illustrate denomination choices. The artwork is conceptual; the exact mass comparison is given in the caption.View full infographic
24 / 50

One kilo. More than one way to hold it.

Equal total silver can come in different denominations, with different purchase costs and resale flexibility.

Read the infographic & sources

One kilo. Different choices. 1 × 1,000 g = 10 × 100 g Same purity. Same fine-silver mass.

Hypothetical comparison using gross weights and 999 fineness. It does not represent a specific mint's product specification or a guaranteed premium difference.

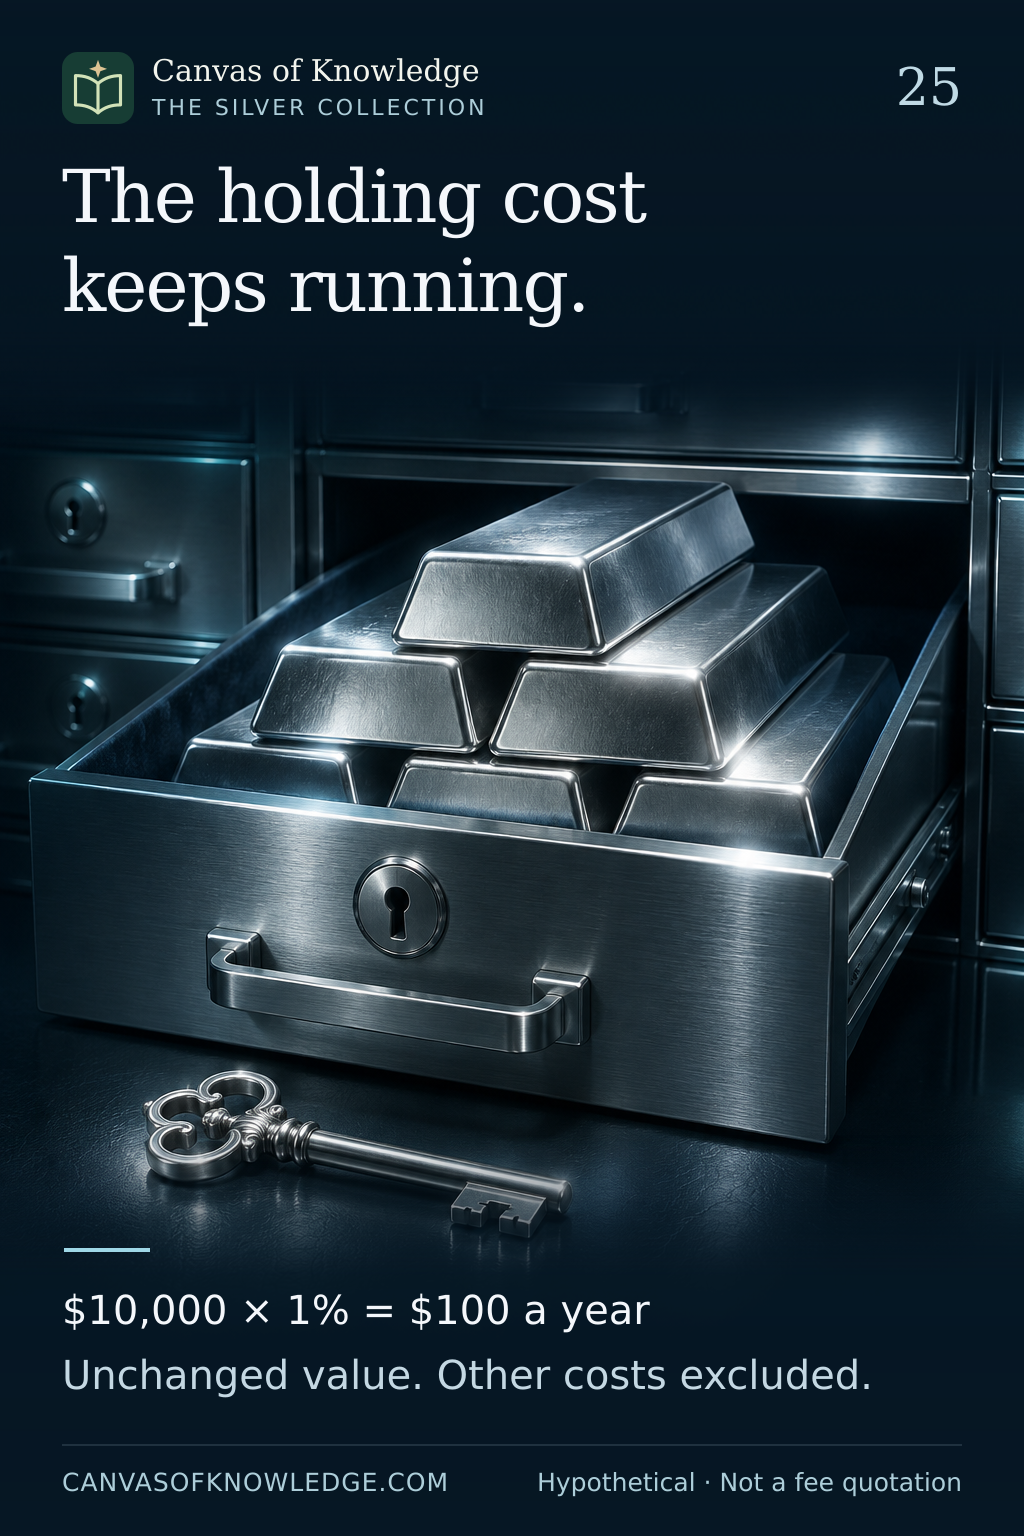
Silver bars in a professional vault drawer beside a key, illustrating custody and ongoing costs.View full infographic
25 / 50

The holding cost keeps running.

Physical silver has a purchase price and an ongoing cost of ownership; storage and insurance belong in the same calculation.

Read the infographic & sources

The holding cost keeps running. $10,000 × 1% = $100 a year Unchanged value. Other costs excluded.

The USD 10,000 and 1% figures are hypothetical. Fees, taxes, insurance scope and custody terms vary by provider, product and jurisdiction.

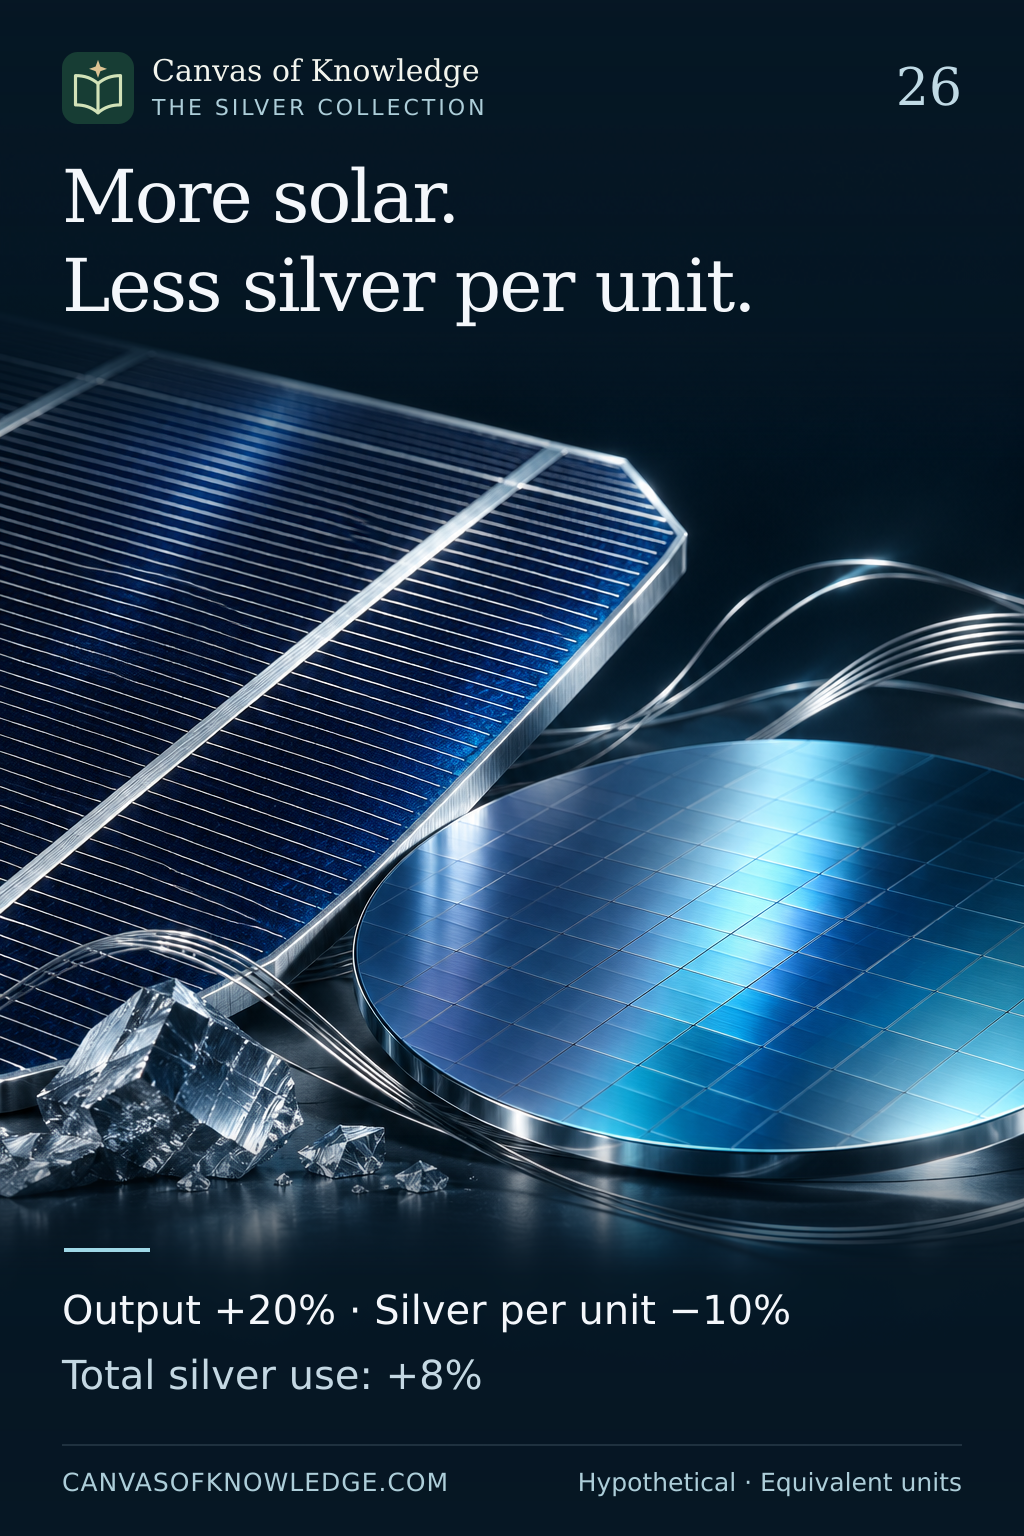
A conceptual solar-cell surface with a fine silver conductive trace; it does not depict a measured loading or a specific cell design.View full infographic
26 / 50

More solar. Less silver per unit.

Why growing technology output does not translate one-for-one into metal demand.

Read the infographic & sources

More solar. Less silver per unit. Output +20% · Silver per unit −10% Total silver use: +8%

Hypothetical arithmetic using equivalent units. The illustration is not a projection of solar production, technology adoption or silver prices.

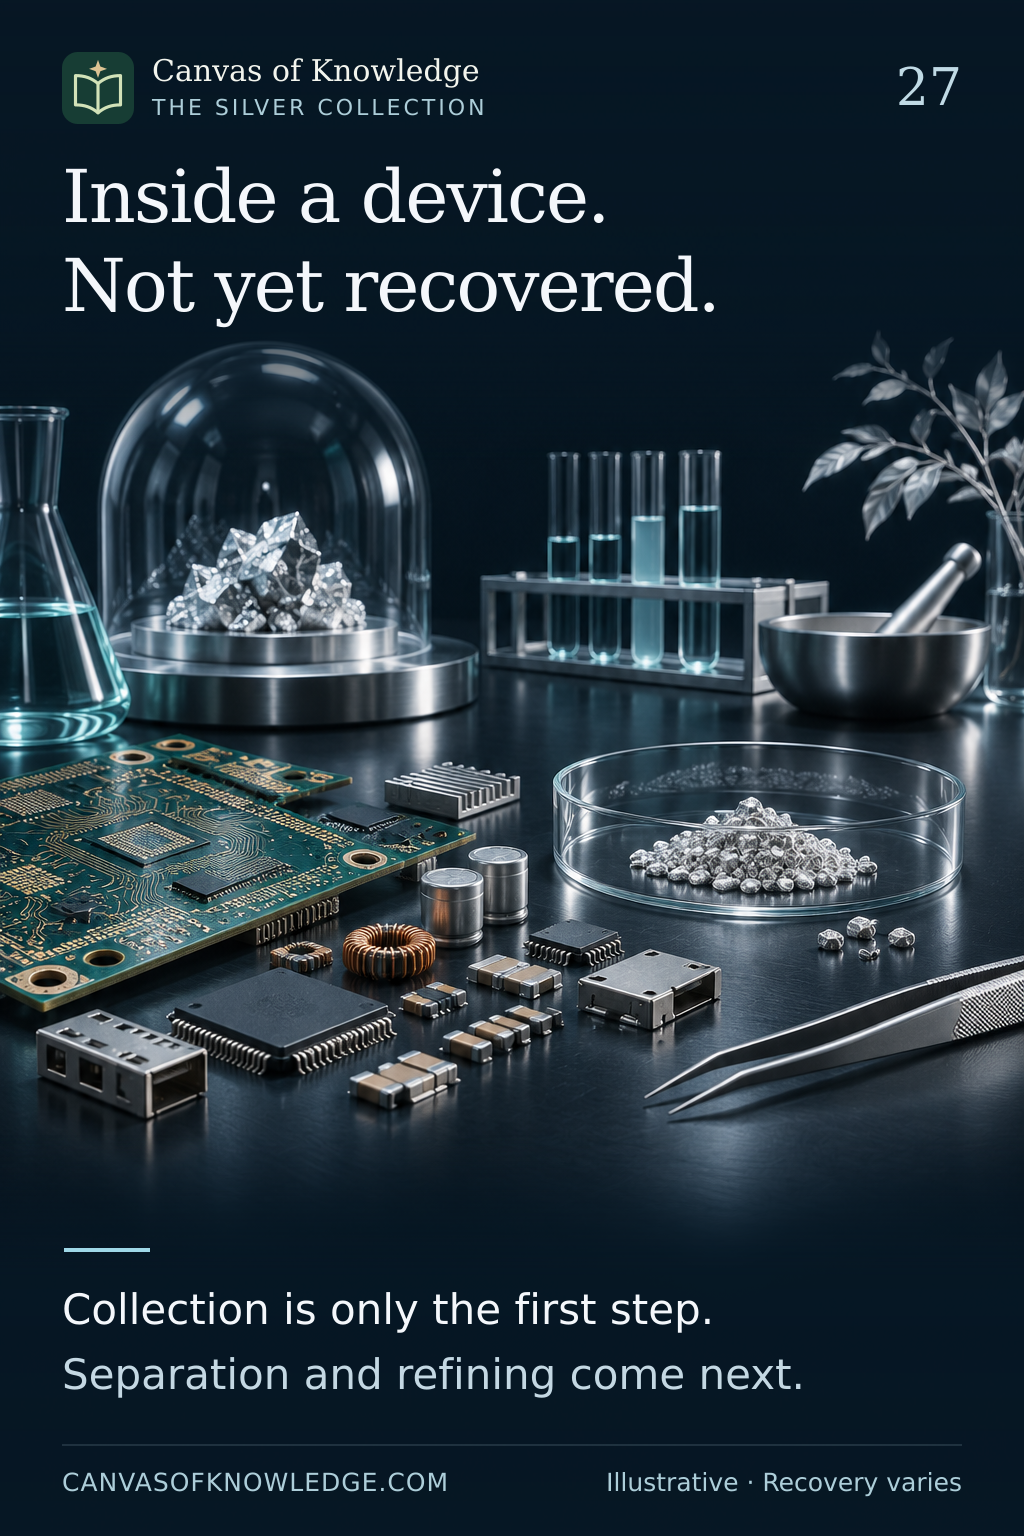
A discarded circuit board beside a conceptual recovered silver bead, illustrating a recovery challenge rather than a measured yield.View full infographic
27 / 50

The silver that does not come back

Why metal inside a discarded device is not automatically recovered metal.

Read the infographic & sources

Inside a device. Not yet recovered. Collection is only the first step. Separation and refining come next.

Illustrative electronics scene. No silver recovery percentage is assigned to a device or recycling process. Professional treatment is required; this is not a home-recovery guide.

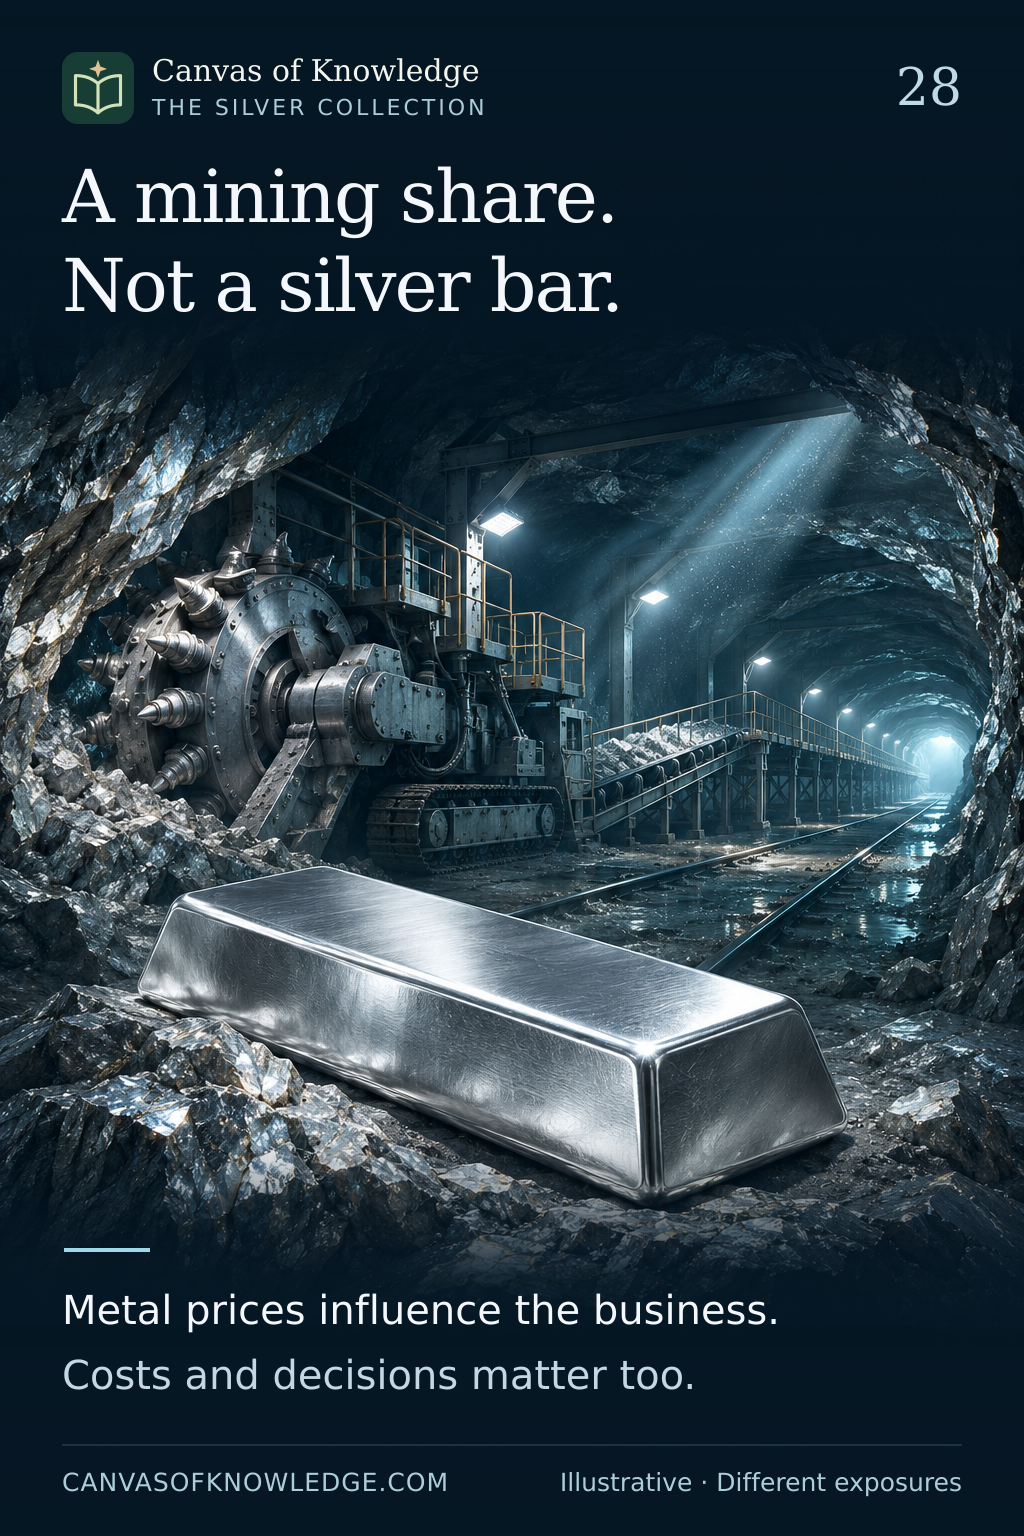
A conceptual silver mine and a silver bar presented as two distinct objects, representing a business and physical metal.View full infographic
28 / 50

A mining share is not a silver bar

One gives exposure to a business. The other is the metal itself.

Read the infographic & sources

A mining share. Not a silver bar. Metal prices influence the business. Costs and decisions matter too.

Company disclosures are used to explain mechanisms, not to recommend a security. No share-price or metal-price forecast is presented.

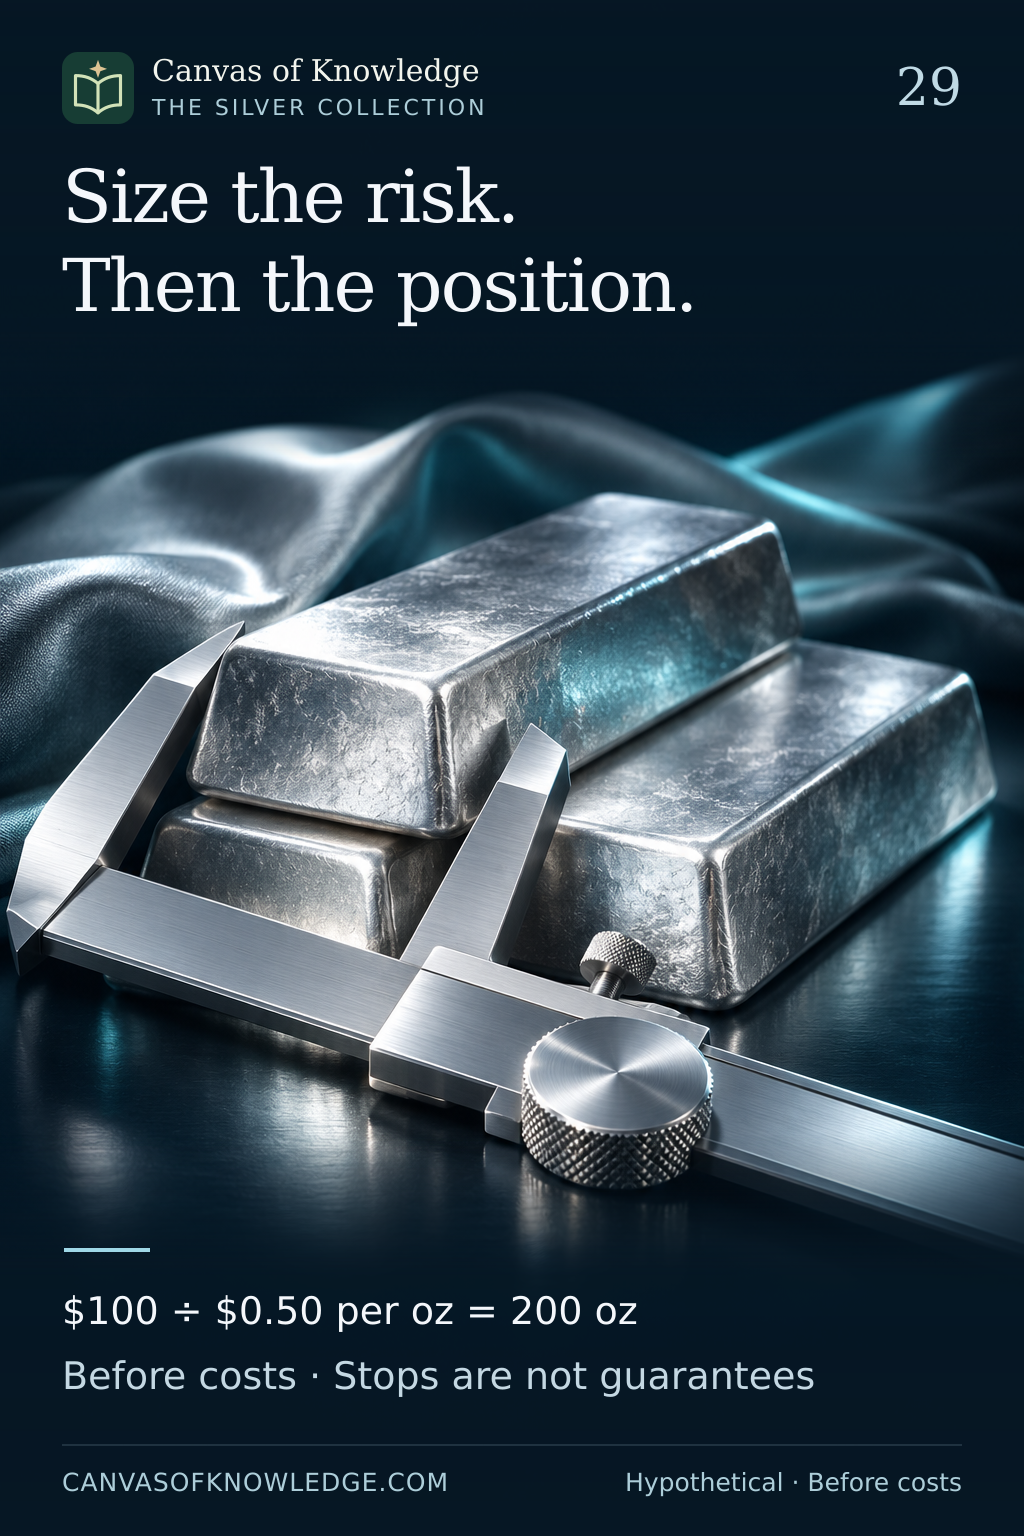
Silver ingots beside a precision measuring instrument, a conceptual illustration of controlling position size.View full infographic
29 / 50

Size the risk before the position

Quantity follows the loss scenario, with room for costs and uncertain execution.

Read the infographic & sources

Size the risk. Then the position. $100 ÷ $0.50 per oz = 200 oz Before costs · Stops are not guarantees

All figures are hypothetical educational examples, not a position-size recommendation. Costs, gaps, lot increments and order rules can change or exceed the planned loss.

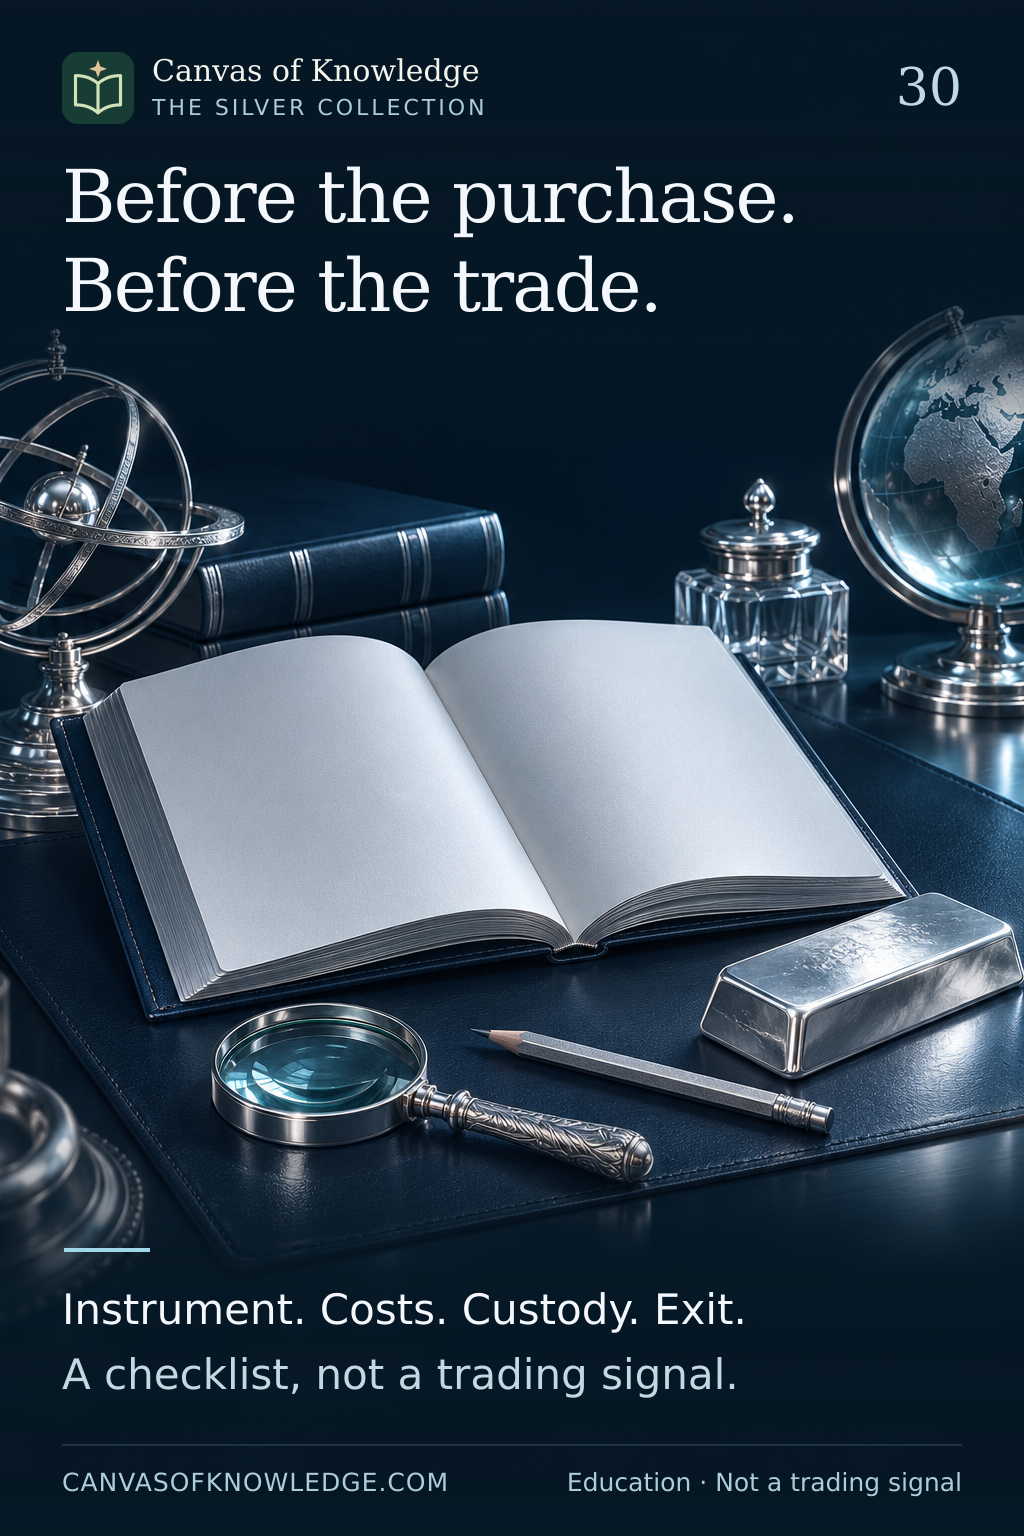
An open notebook, a silver bar, a magnifier and a pencil illustrate a research checklist.View full infographic
30 / 50

Before the purchase. Before the trade.

A final set of questions that connects the metal, the product and the process.

Read the infographic & sources

Before the purchase. Before the trade. Instrument. Costs. Custody. Exit. A checklist, not a trading signal.

Educational review checklist. It is not investment advice, a trading signal or a guarantee of suitability, liquidity or safety.

CHAPTER 04 / 31—40

The forces around silver

Prices, purchasing power, hedging and the evidence behind the headlines.

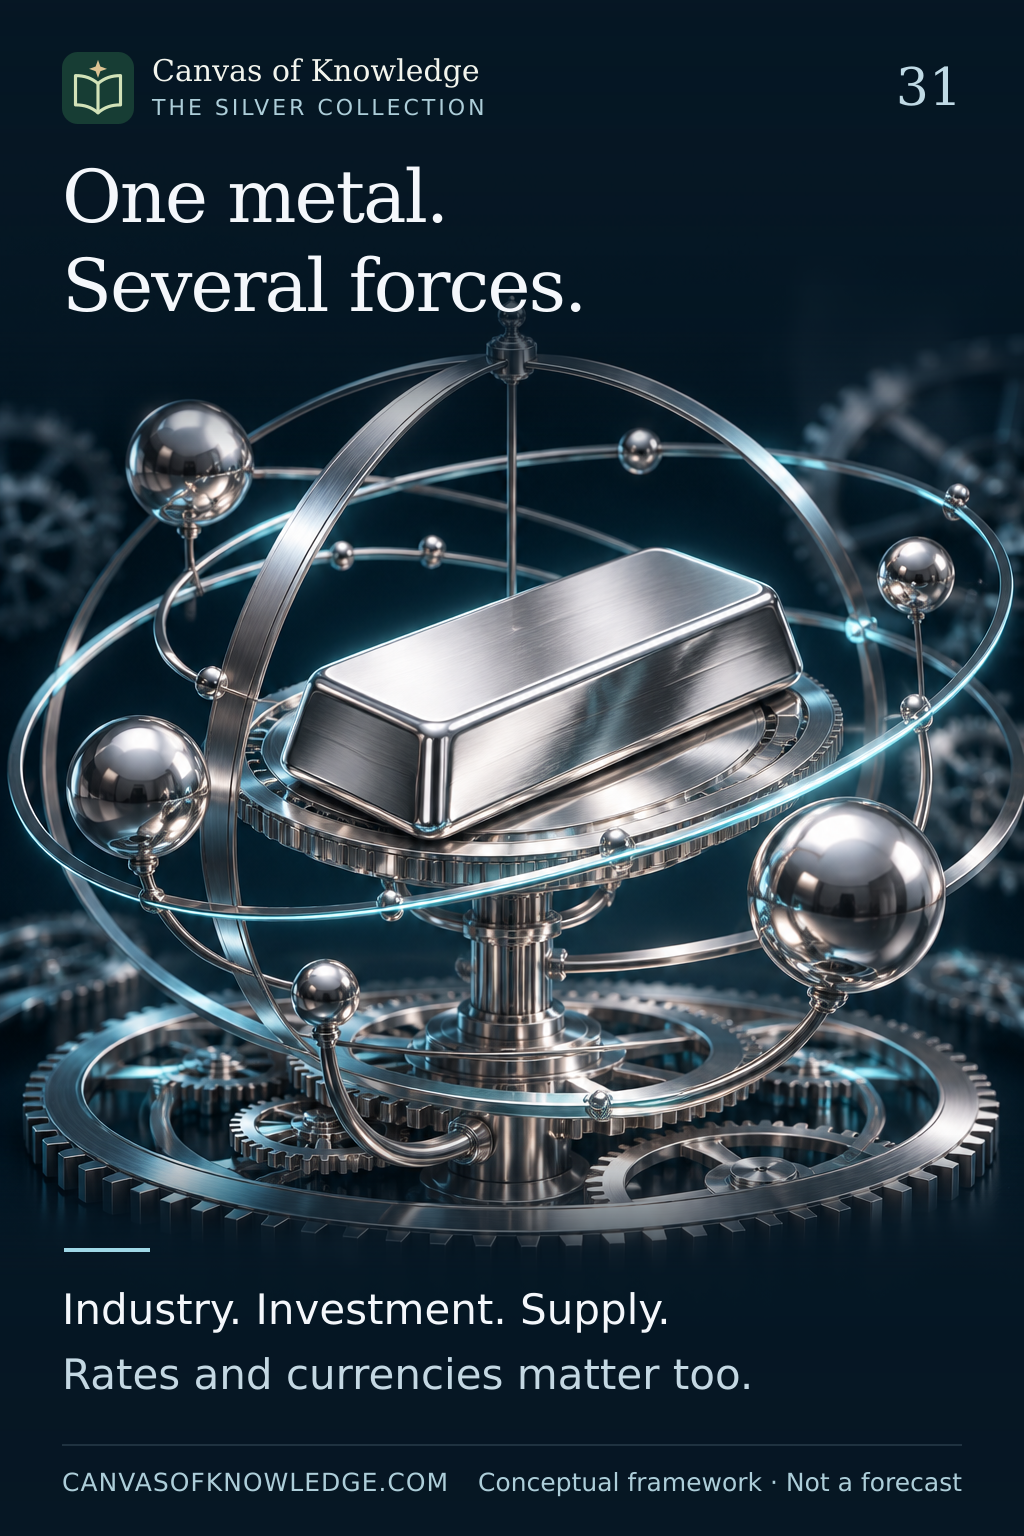
A silver ingot inside an illuminated sculptural framework, surrounded by a gear and metallic spheres, symbolises the forces affecting silver prices.View full infographic
31 / 50

One metal. Several moving forces.

Industrial demand, investor behaviour and the conditions that connect them.

Read the infographic & sources

One metal. Several forces. Industry. Investment. Supply. Rates and currencies matter too.

Conceptual framework. No price forecast, live quotation or investment recommendation is implied.

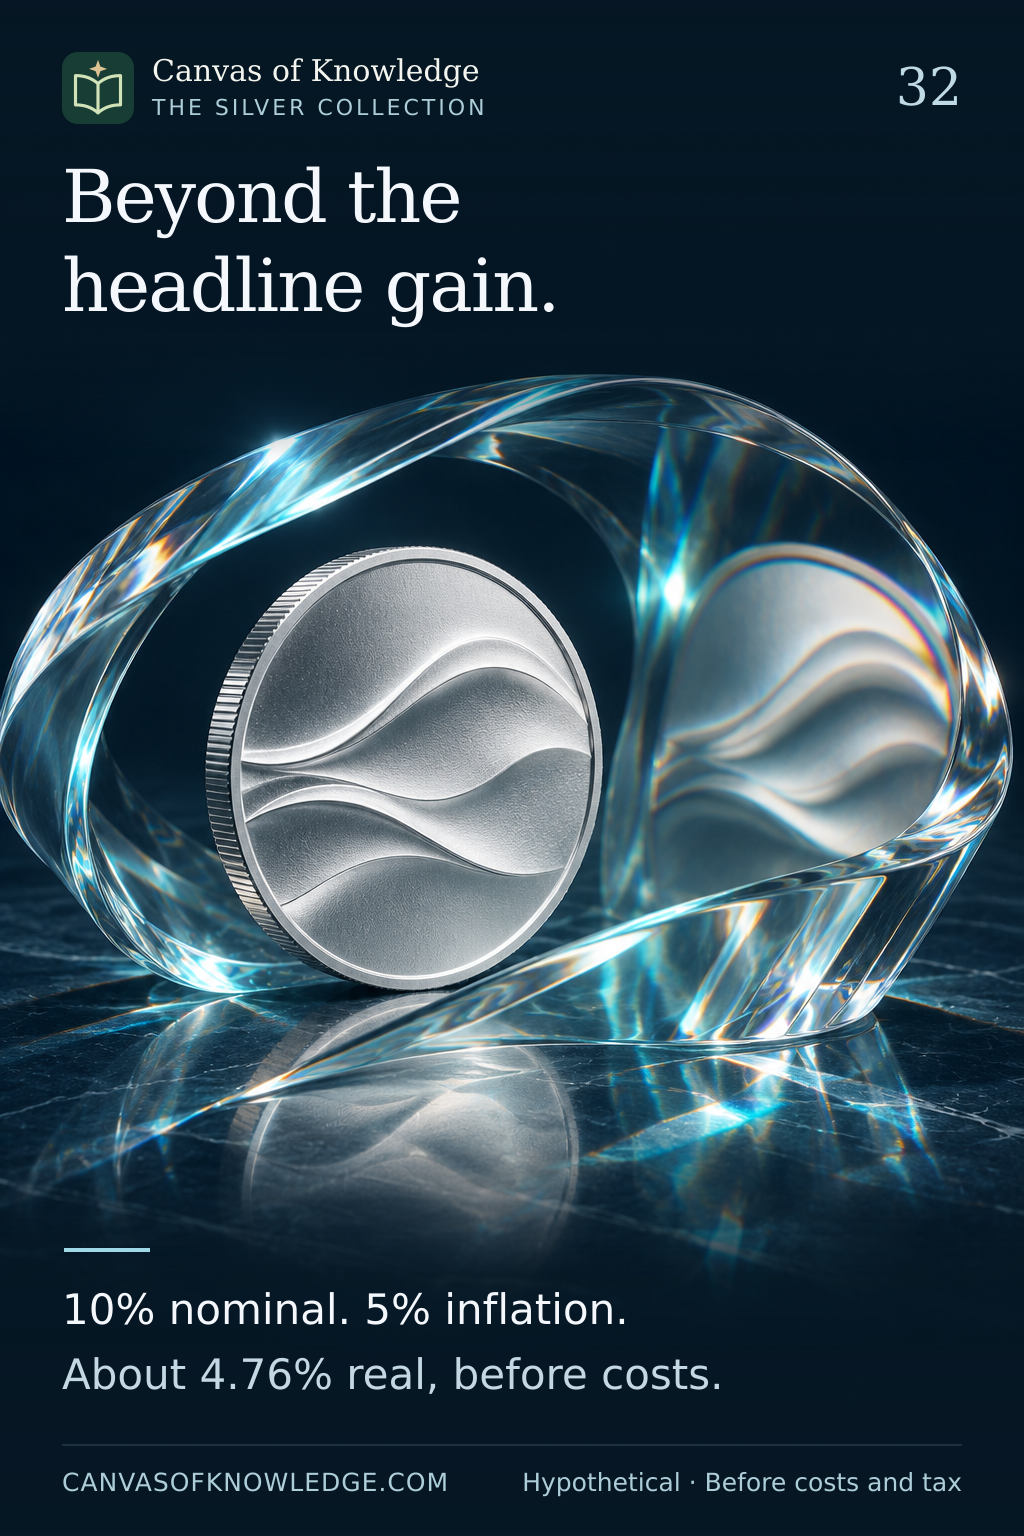
A silver coin viewed through a translucent glass lens illustrates the difference between a monetary gain and purchasing power.View full infographic
32 / 50

A bigger number. How much more buying power?

The difference between a nominal gain and a gain after inflation.

Read the infographic & sources

Beyond the headline gain. 10% nominal. 5% inflation. About 4.76% real, before costs.

Hypothetical arithmetic: 10% nominal return and 5% inflation yield approximately 4.76% real return before costs and tax. This is not a forecast.

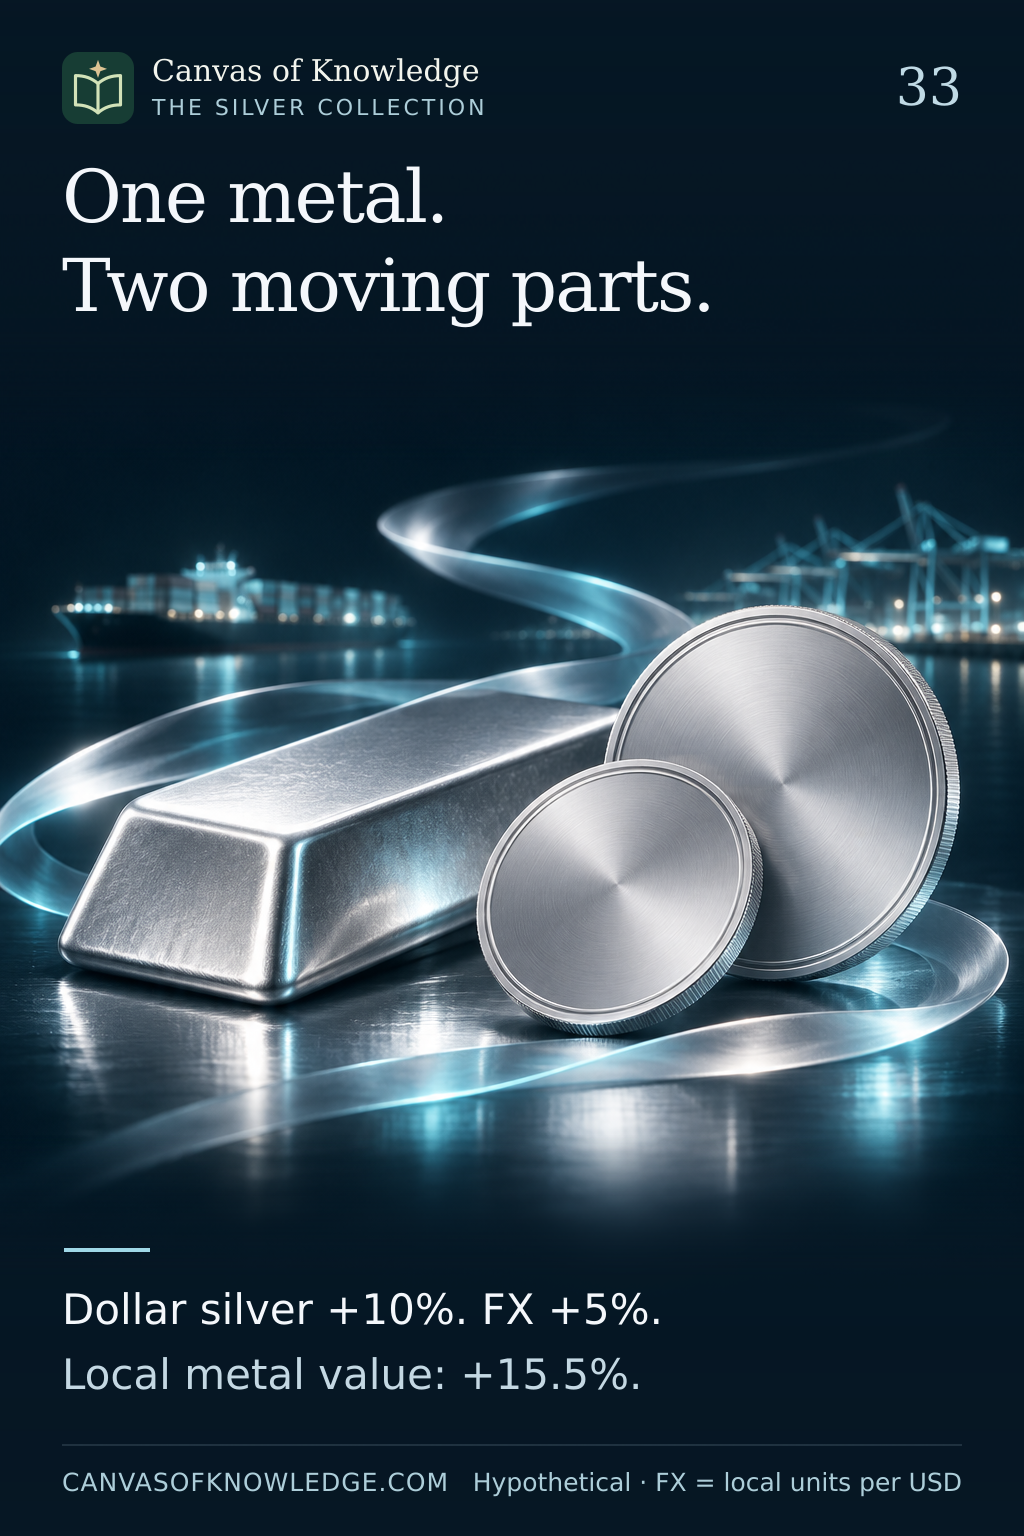
A silver ingot and two blank metallic medallions illustrate the combined effects of metal prices and currency translation.View full infographic
33 / 50

One metal price. Two moving parts.

Why a dollar return can differ from the return measured in your own currency.

Read the infographic & sources

One metal. Two moving parts. Dollar silver +10%. FX +5%. Local metal value: +15.5%.

All prices and exchange rates are hypothetical. The example excludes costs and tax and makes no current claim about AED or any currency arrangement.

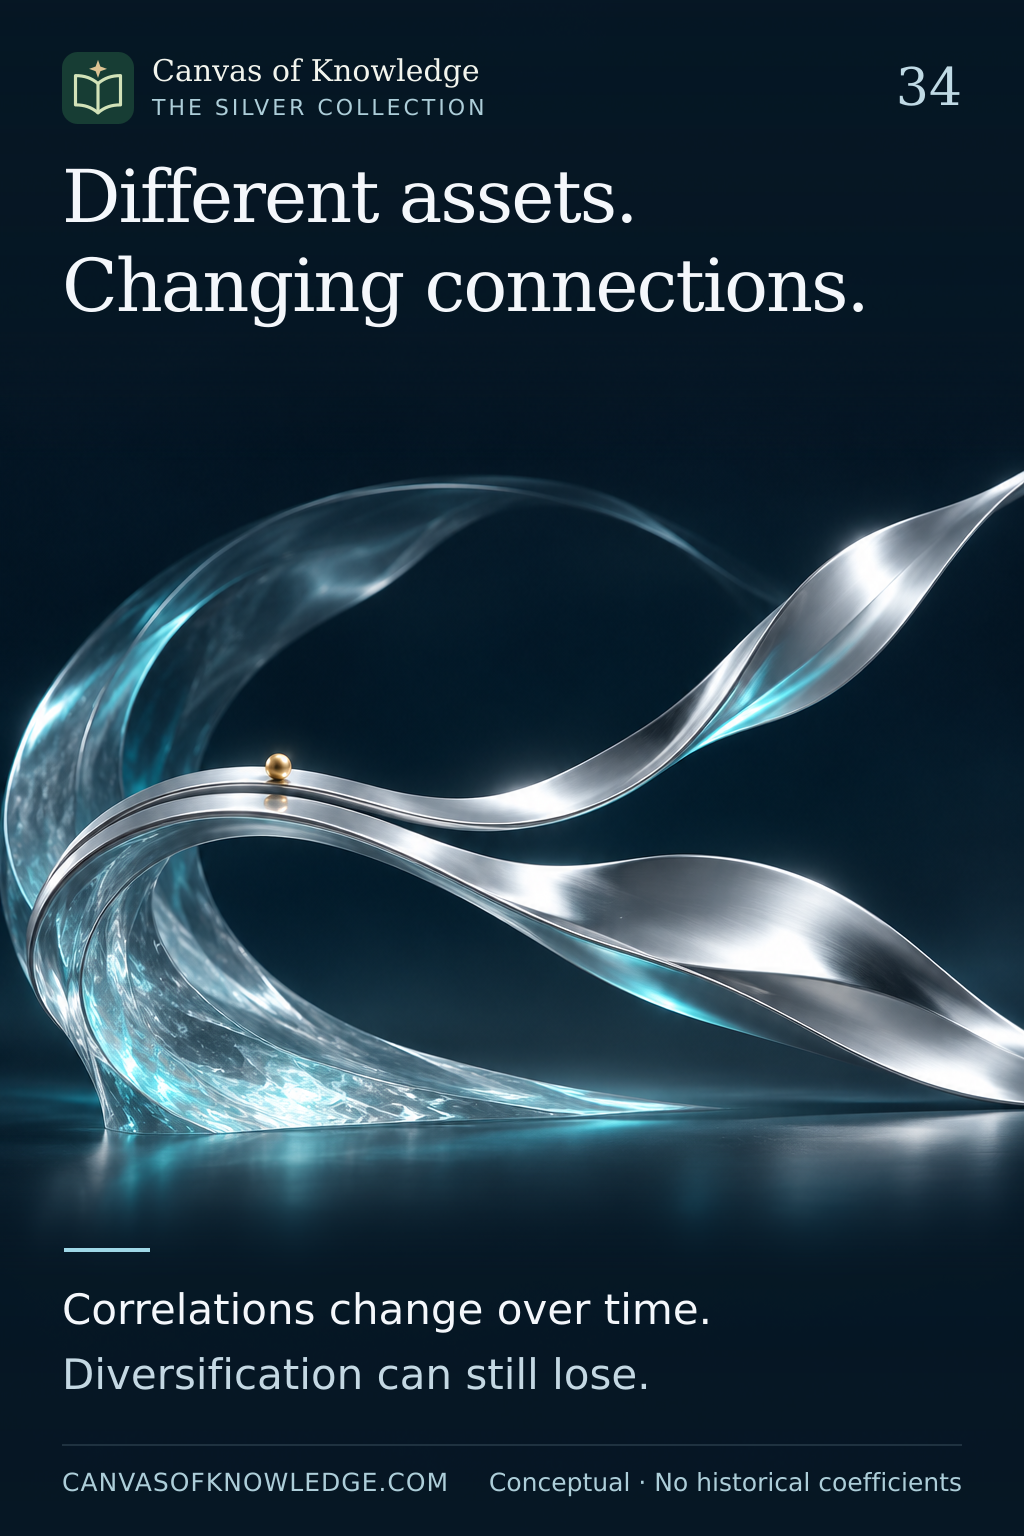
Two silver ribbons travel together before separating, with a small gold accent, illustrating relationships that change rather than a measured market correlation.View full infographic
34 / 50

Diversification is a relationship, not a label.

Why silver’s connection with gold and shares must be examined over time.

Read the infographic & sources

Different assets. Changing connections. Correlations change over time. Diversification can still lose.

Conceptual explanation. No historical correlation coefficients, optimal allocation or guaranteed diversification benefit is claimed.

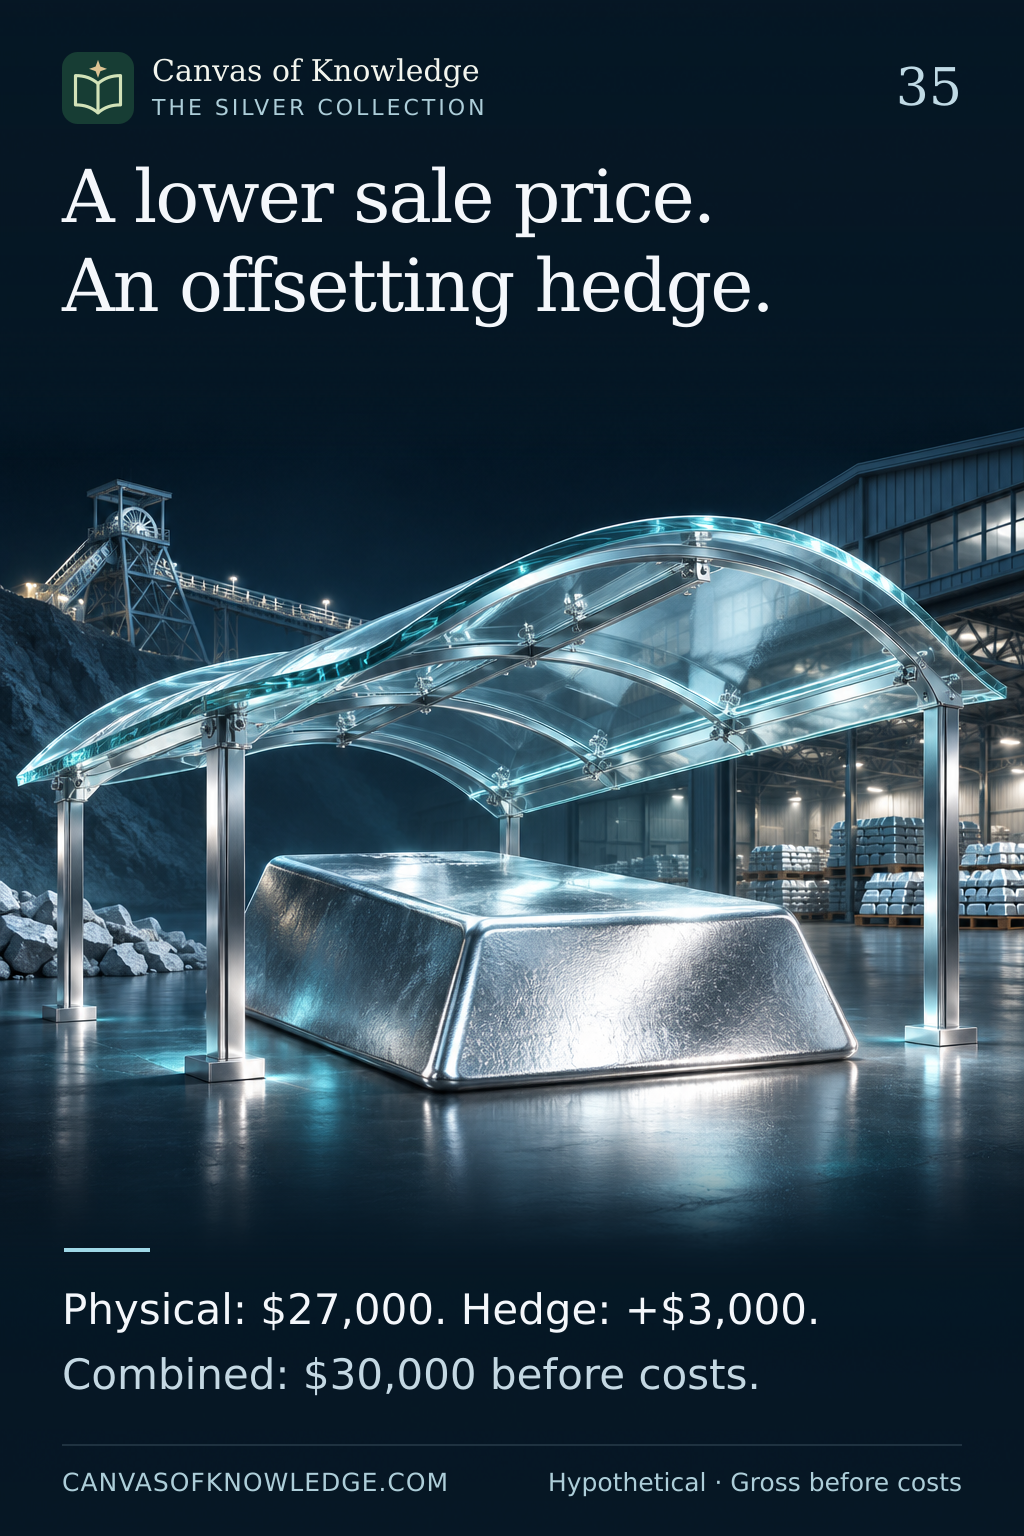
A silver ingot beneath a transparent architectural shield symbolises a producer’s hedge; it does not imply guaranteed protection.View full infographic
35 / 50

A lower selling price. An offsetting hedge.

How an idealised short futures hedge can stabilise a producer’s sale proceeds.

Read the infographic & sources

A lower sale price. An offsetting hedge. Physical: $27,000. Hedge: +$3,000. Combined: $30,000 before costs.

Idealised, perfectly matched hypothetical example. USD 30,000 is combined gross proceeds before costs, not profit. The quantity does not describe an actual futures contract.

Two hourglass forms and a silver ingot on a curved track illustrate moving exposure from one contract expiry to another.View full infographic
36 / 50

Keep the exposure. Change the contract.

A futures position has a calendar. Continuing the exposure means managing that calendar.

Read the infographic & sources

Keep the exposure. Change the contract. Close one expiry. Open the next. A rolled return is not spot.

Conceptual explanation. Contract rules and product methodologies differ; this is not a trading instruction.

Two silver pathways diverge slightly, illustrating the imperfect match between a local cash price and a futures hedge.View full infographic
37 / 50

A hedge can leave a gap behind.

Your local silver price and the hedge contract are related, but they are not identical.

Read the infographic & sources

A hedge can leave a gap behind. Basis = cash price − futures price Two prices can move differently.

Prices are hypothetical. This article uses basis = cash price − futures price; other sources may reverse the sign.

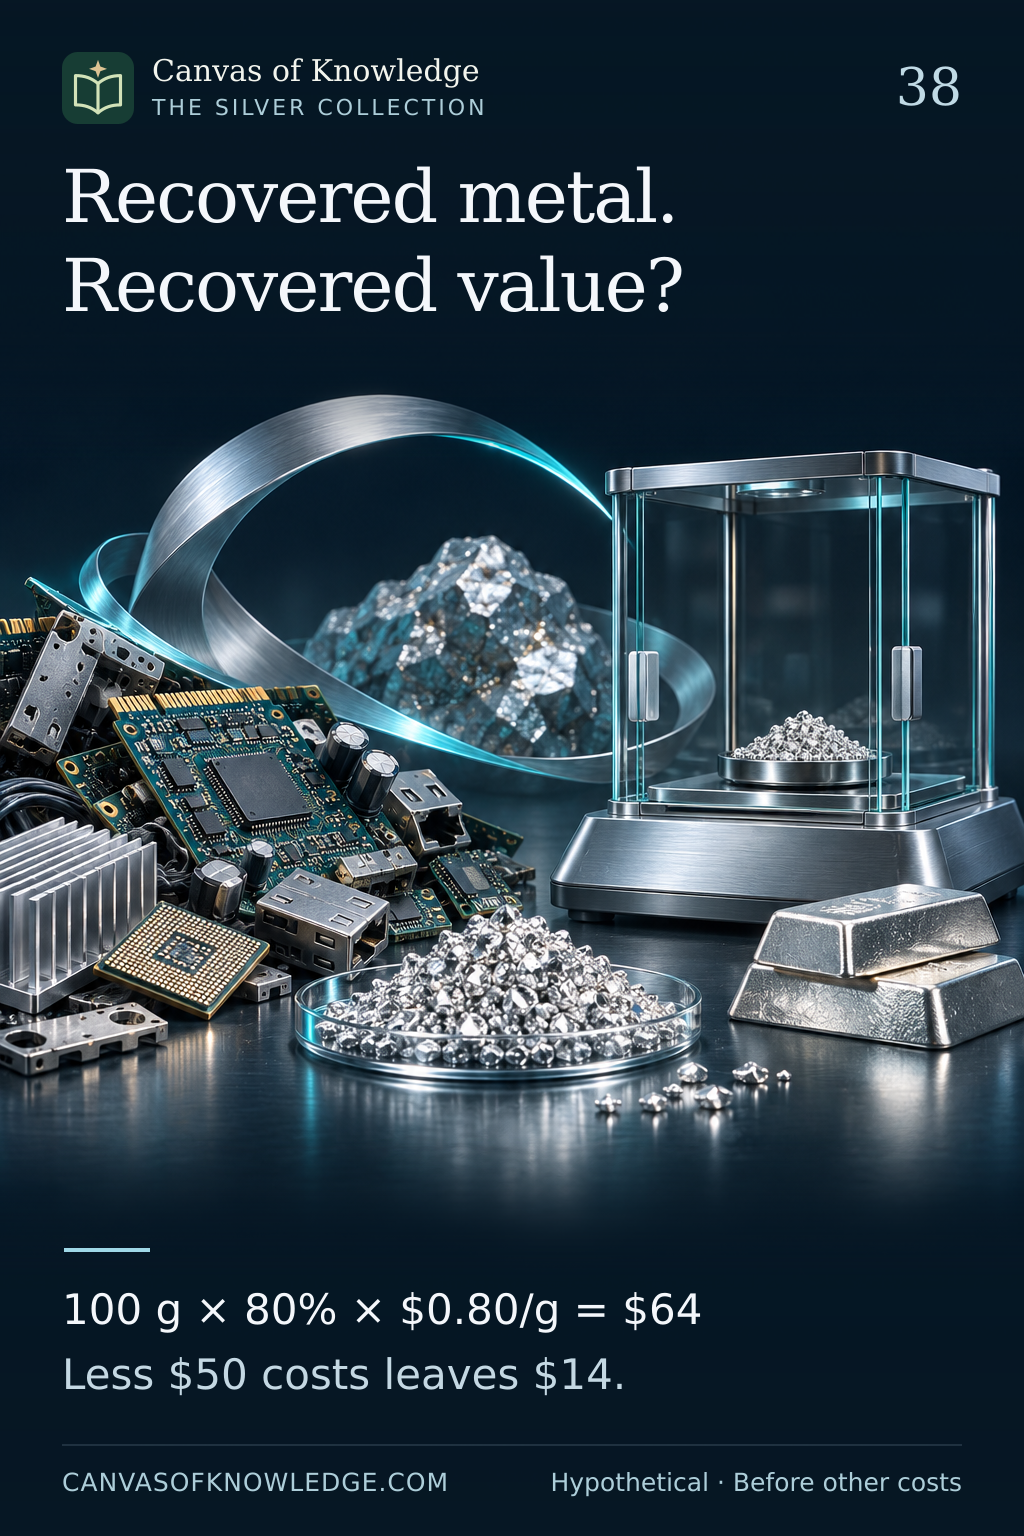
Discarded electronic components and refined silver granules on a professional workbench illustrate the steps between contained metal and recovered value.View full infographic
38 / 50

Recovered metal. Recovered value?

The silver inside an object is only the beginning of the recycling calculation.

Read the infographic & sources

Recovered metal. Recovered value? 100 g × 80% × $0.80/g = $64 Less $50 costs leaves $14.

All numbers are hypothetical: 100 g × 80% × $0.80/g = $64; $64 − $50 = $14 before other costs. No recovery yield or price is forecast.

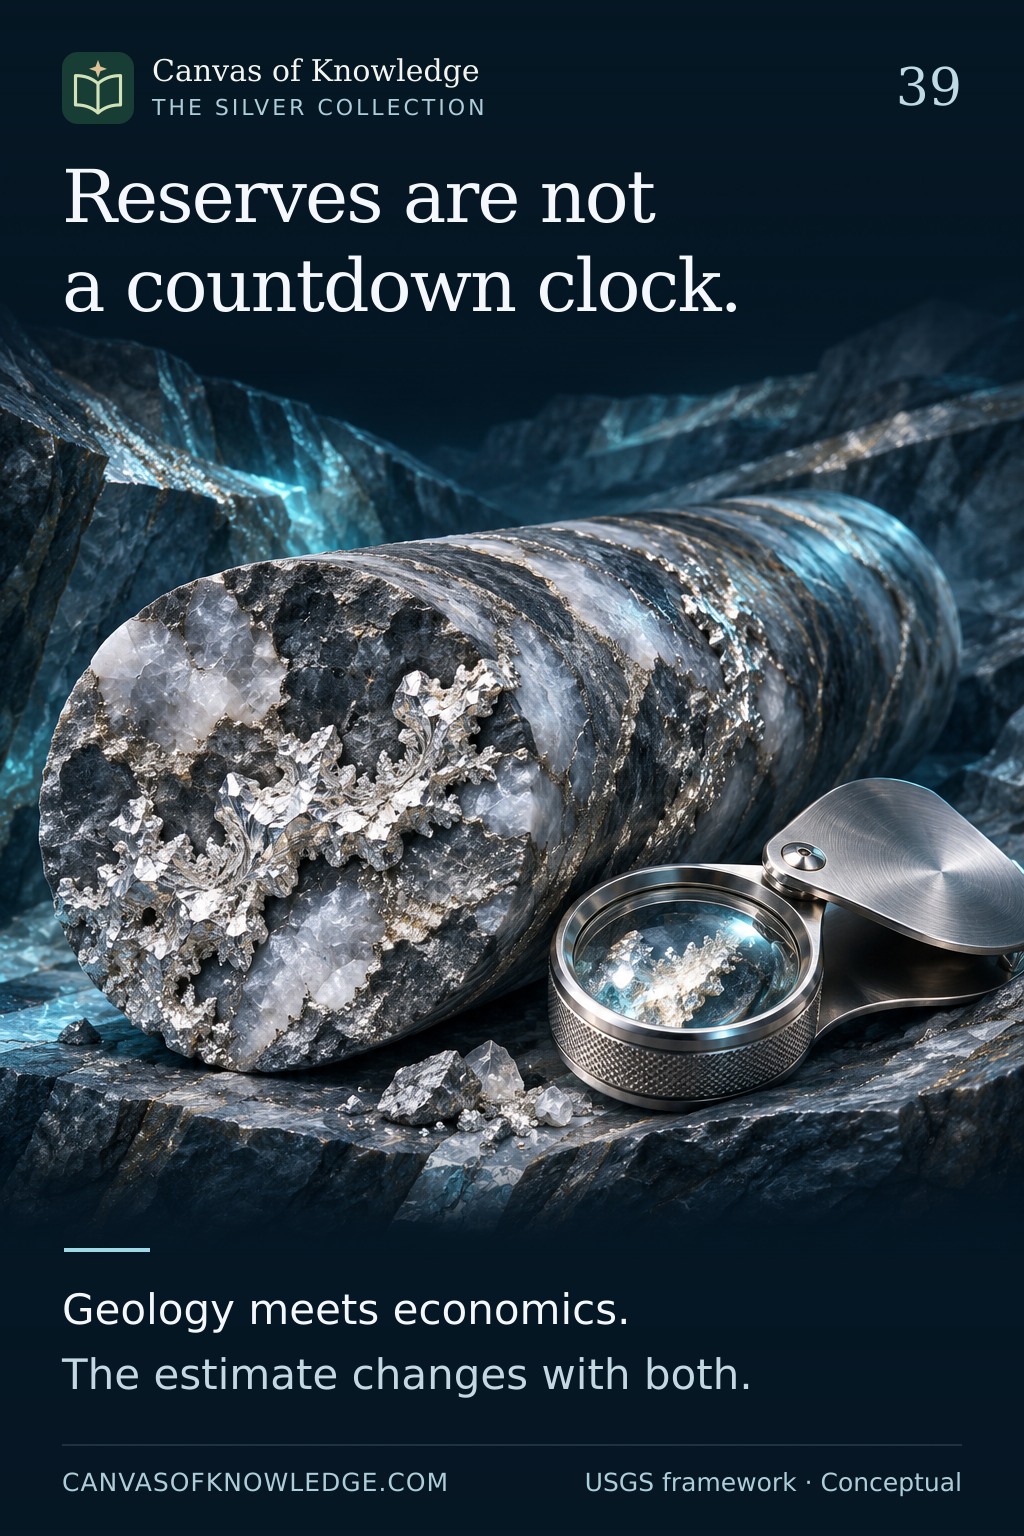
A silver-bearing rock sample, geological strata and a magnifier illustrate the evidence behind changing resource and reserve estimates.View full infographic
39 / 50

Reserves are not a countdown clock.

A geological estimate becomes a reserve estimate only after economic and technical questions enter the picture.

Read the infographic & sources

Reserves are not a countdown clock. Geology meets economics. The estimate changes with both.

Conceptual explanation based on USGS terminology. Reporting frameworks can differ; consult the definitions attached to each estimate.

A research notebook, magnifier and silver ingot on a dark desk illustrate checking definitions and evidence before interpreting a headline.View full infographic
40 / 50

Before the headline, read the definition.

A research dashboard starts with comparable evidence, not a dramatic number.

Read the infographic & sources

Before the headline, read the definition. Flow or stock? Estimate or fact? Check units, dates and coverage.

Research framework, not a market forecast. Inventory totals do not by themselves establish freely available supply.

CHAPTER 05 / 41—50

The details that matter

Industrial science, provenance and the mechanics of market decisions.

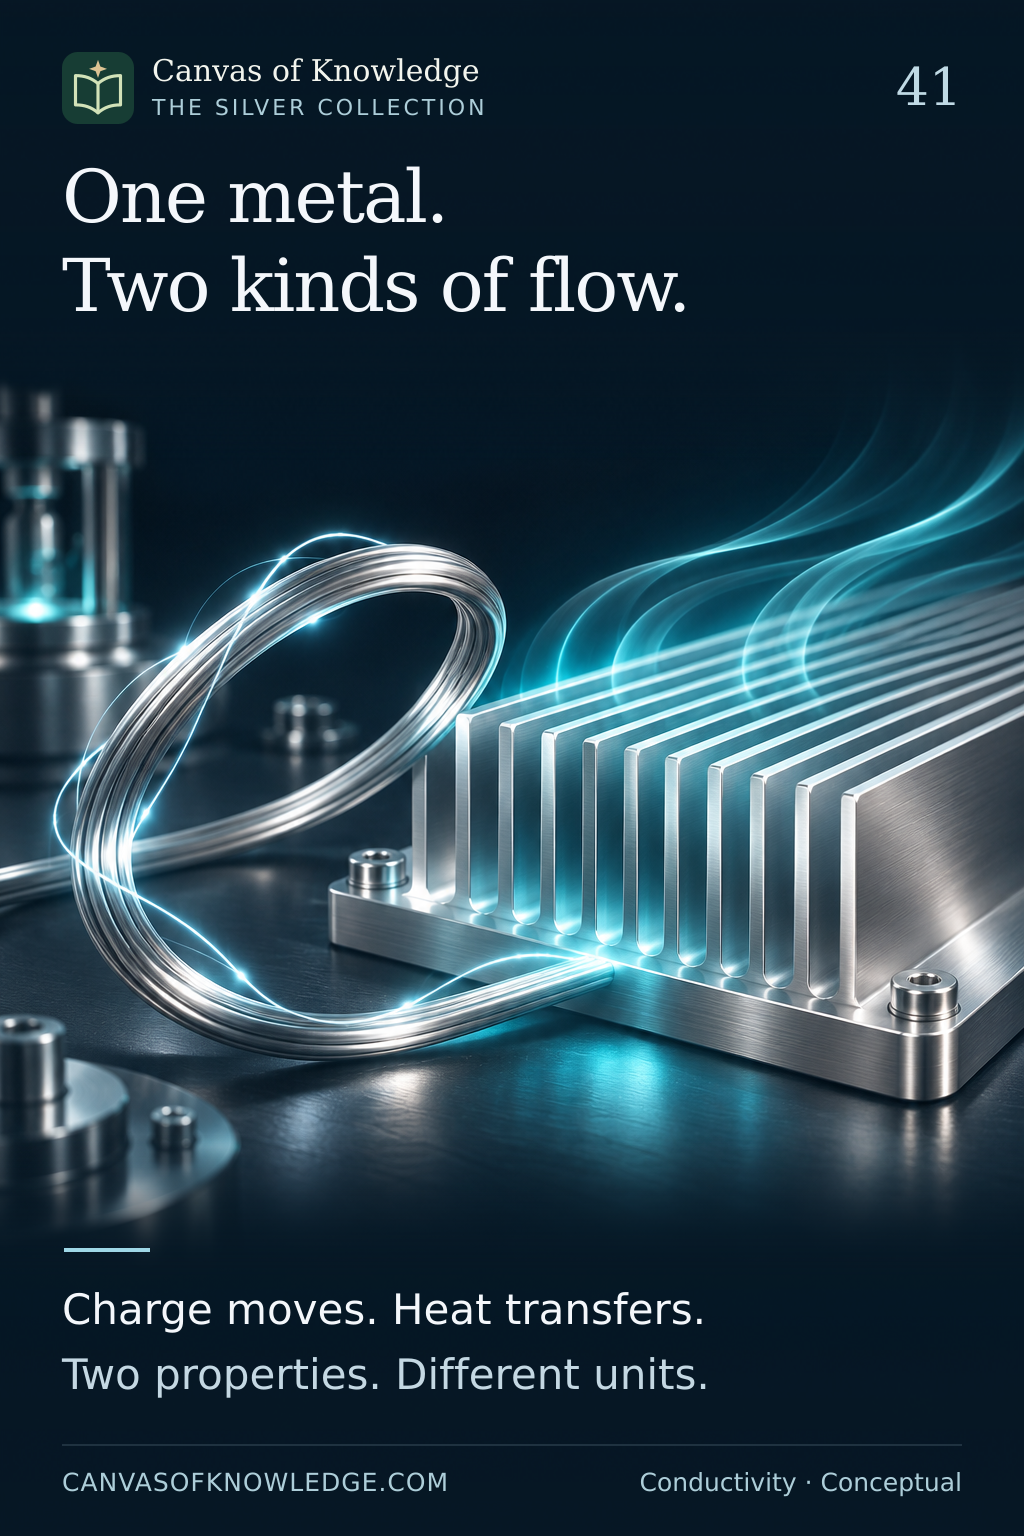
A silver wire loop beside polished heat-dissipation fins illustrates electrical and thermal conduction; the light trails are conceptual.View full infographic
41 / 50

One metal. Two kinds of transport.

Why silver conducts both electricity and heat—and why the measurements are different.

Read the infographic & sources

One metal. Two kinds of flow. Charge moves. Heat transfers. Two properties. Different units.

Conceptual explanation. Properties depend on material form, composition and measurement conditions; no product performance is guaranteed.

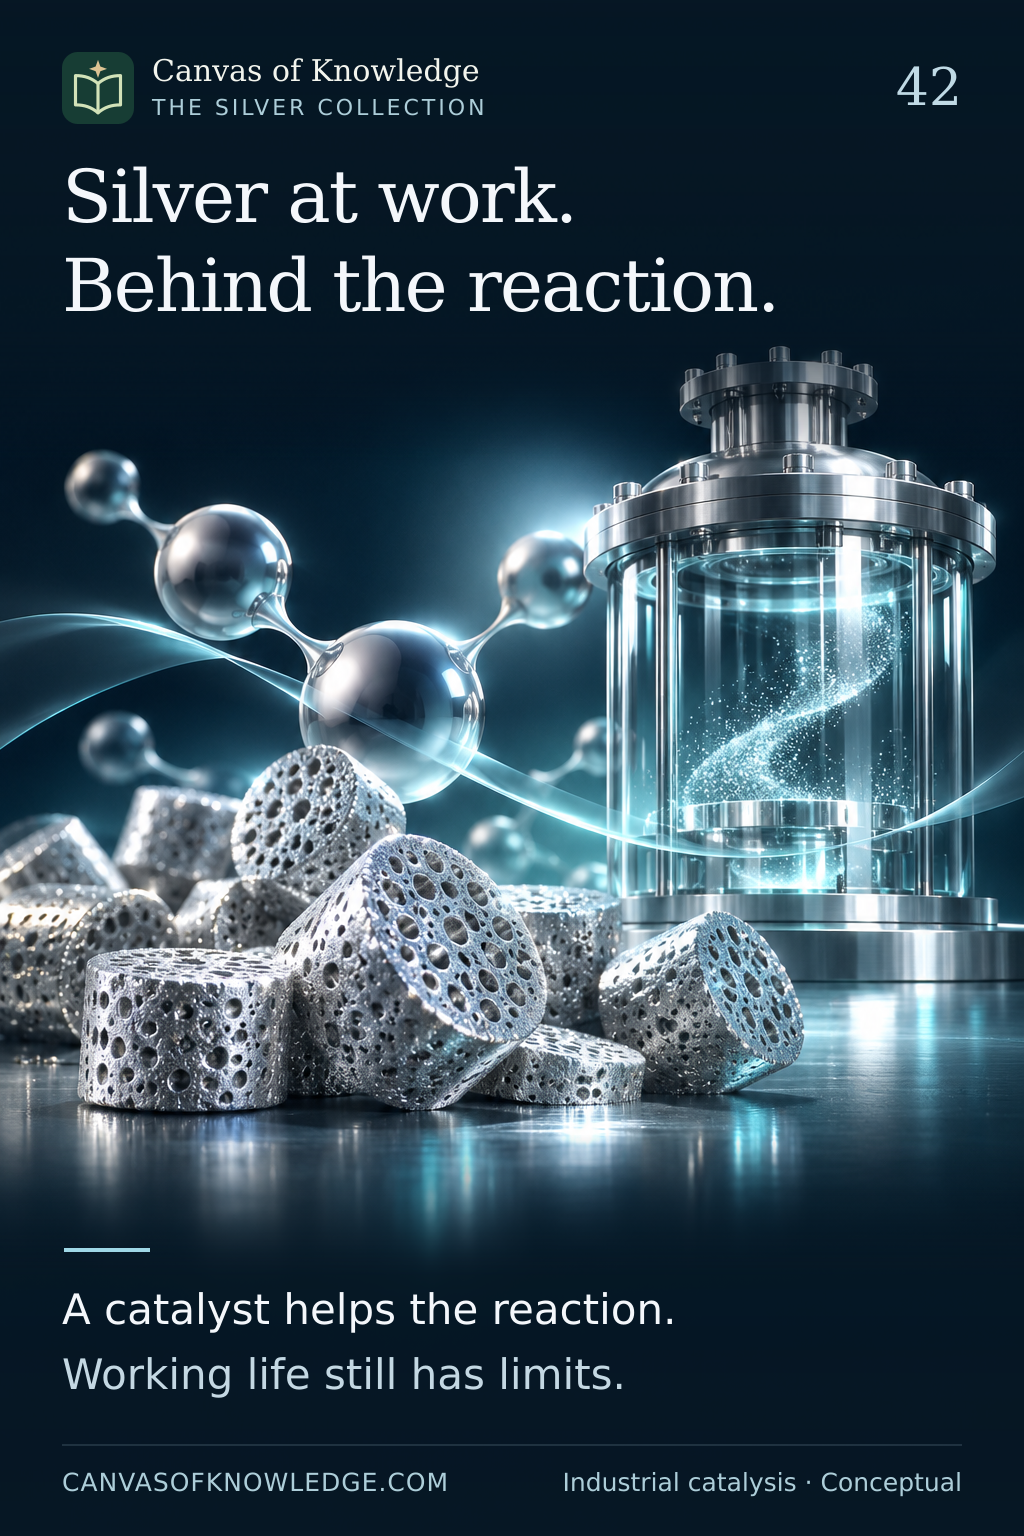
Porous silver-coloured pellets beside a transparent industrial reactor and abstract molecular spheres illustrate industrial catalysis, not a technical chemical diagram.View full infographic
42 / 50

Silver can help chemistry take a different path.

A precious metal working quietly inside industrial chemical production.

Read the infographic & sources

Silver at work. Behind the reaction. A catalyst helps the reaction. Working life still has limits.

High-level industrial explanation. No chemical-production procedure, operating conditions or recovery instructions are provided.

Overlapping metallic plates with a smooth silver-coloured braze fillet illustrate joining solid parts with a filler alloy.View full infographic
43 / 50

A small seam. A demanding job.

How silver-containing filler alloys help join larger pieces of metal.

Read the infographic & sources

A small seam. A demanding job. Filler melts. Parts remain solid. Composition shapes performance.

Conceptual overview. The 450°C distinction classifies filler-metal melting behaviour; it is not a workshop operating recommendation.

Unbranded silver-coloured button cells beside a closed-face quartz wristwatch illustrate compact battery applications.View full infographic
44 / 50

A small cell. A steady role.

Silver oxide chemistry inside compact power sources.

Read the infographic & sources

A small cell. A steady role. Silver oxide meets zinc. Chemistry powers the circuit.

General materials explanation. Common silver-oxide button cells are primary batteries; rechargeable silver-zinc products are a distinct design category.

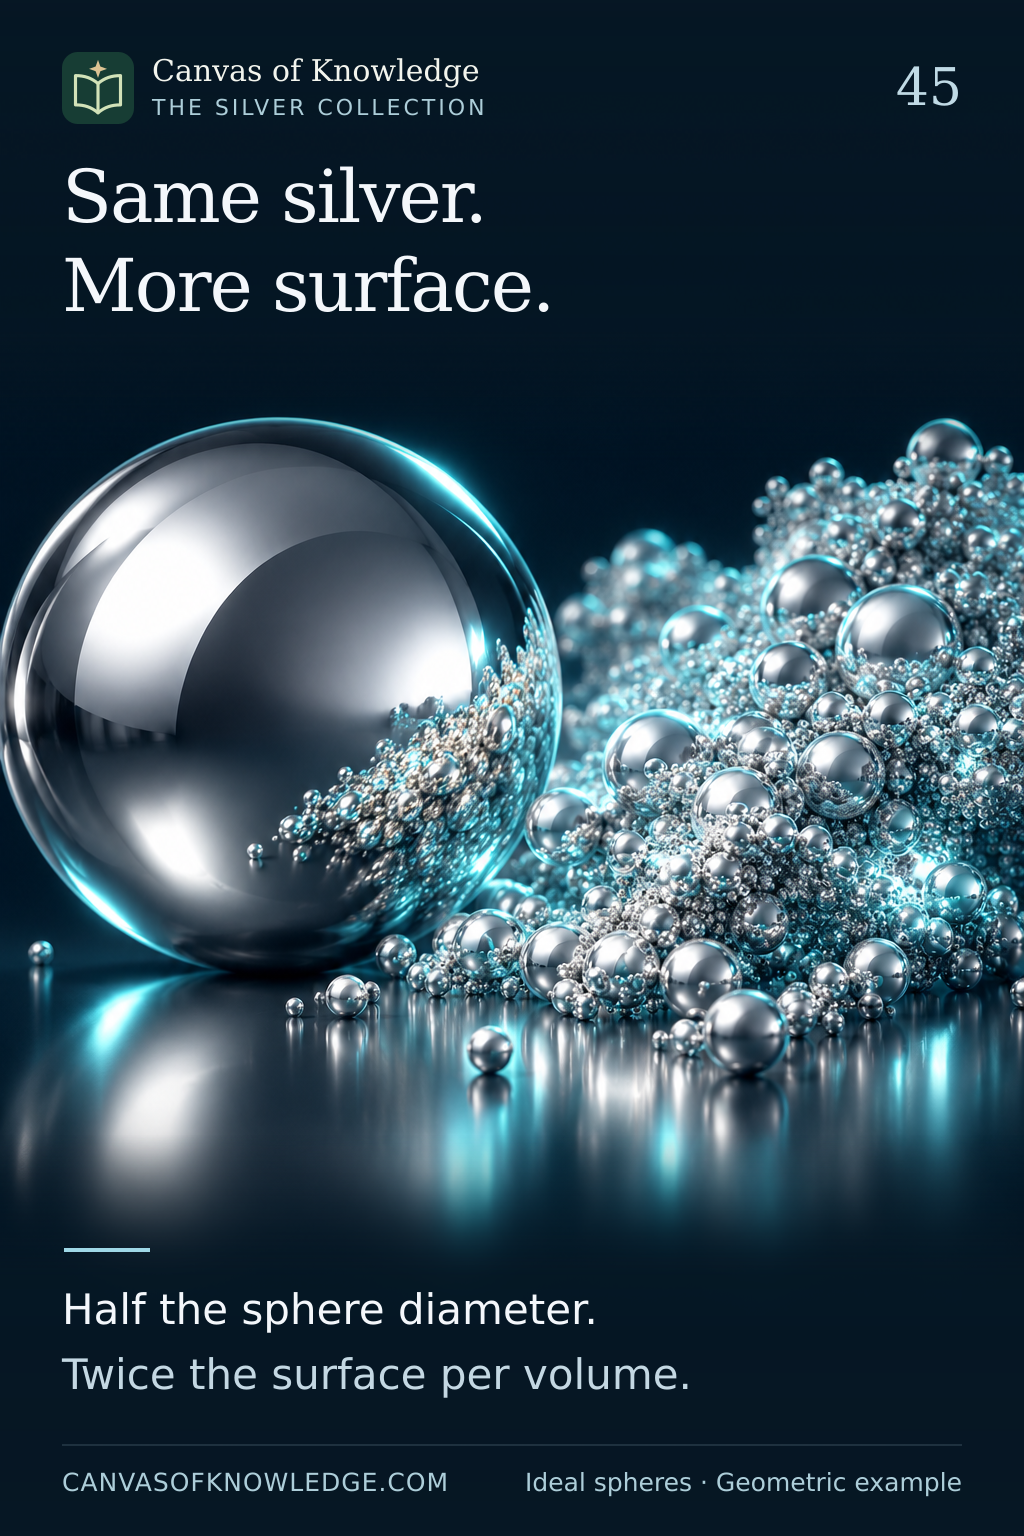
A large silver sphere beside many smaller spheres illustrates the growing importance of surface area at smaller scales; the scene is conceptual rather than a measured comparison.View full infographic
45 / 50

Same silver. More surface.

At smaller scales, geometry changes how much material meets its surroundings.

Read the infographic & sources

Same silver. More surface. Half the sphere diameter. Twice the surface per volume.

Idealised geometric example. Halving sphere diameter doubles surface area per unit volume; real particle shape, coatings and aggregation can alter accessible surface and behaviour.

A silver ingot beside a blank provenance document and an illuminated route illustrates tracing the material’s supply chain.View full infographic
46 / 50

The story behind the silver.

Provenance asks where the metal came from—and how the risks along its journey were addressed.

Read the infographic & sources

The story behind the silver. Trace the route. Examine the risks. Assurance has a defined scope.

Conceptual sourcing framework. Certification and assurance have defined scopes; neither guarantees investment performance.

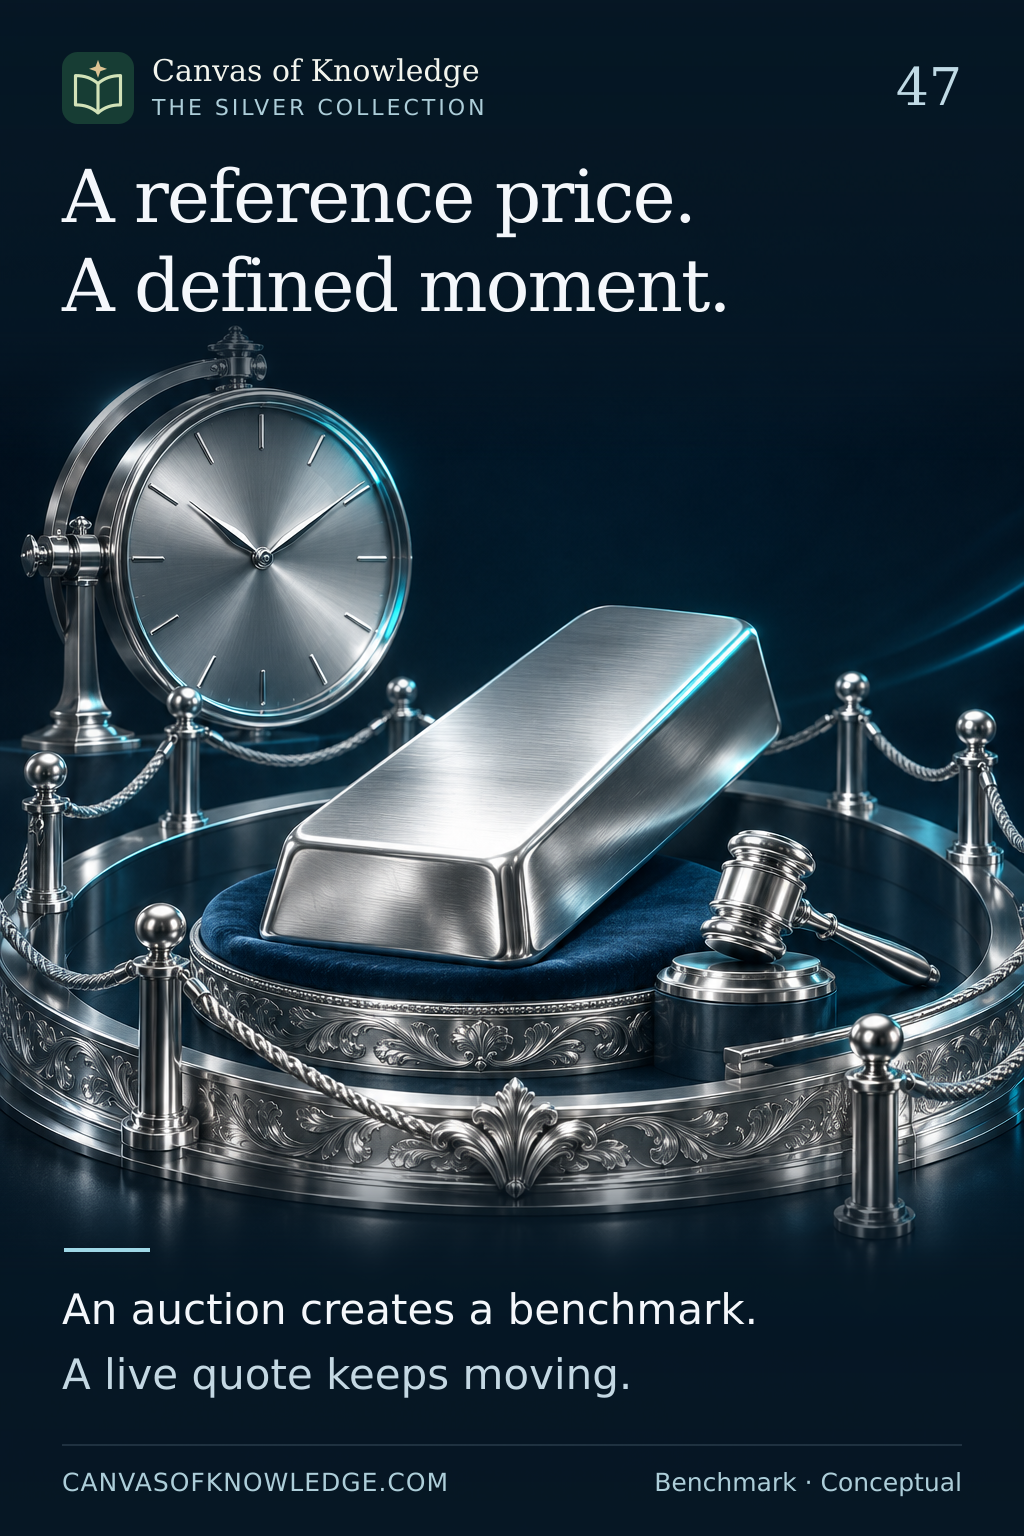
A silver ingot framed by an auction-inspired setting and a clock illustrates a benchmark associated with a defined moment.View full infographic
47 / 50

A reference price. A defined moment.

How an auction benchmark differs from the quotation moving across a trading screen.

Read the infographic & sources

A reference price. A defined moment. An auction creates a benchmark. A live quote keeps moving.

Conceptual benchmark explanation. No live benchmark data are reproduced, and no data-access or redistribution right is implied.

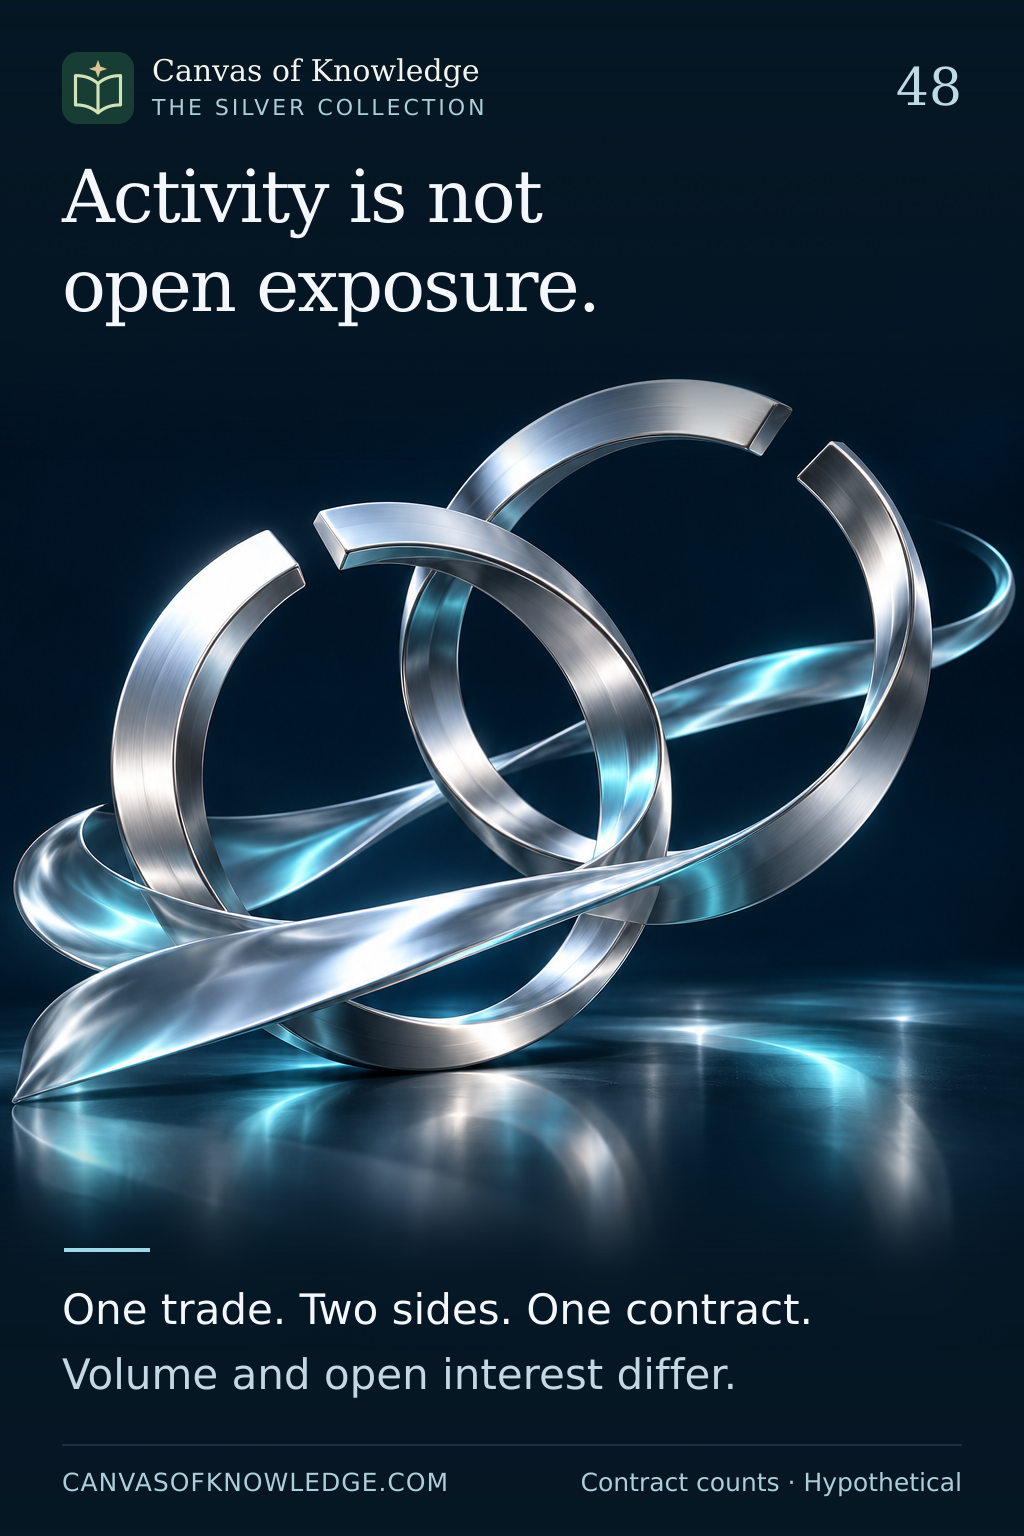
Interlocking silver rings and a flowing metallic ribbon symbolise the difference between outstanding contracts and trading activity.View full infographic
48 / 50

Activity and exposure count different things.

Volume measures trading during a period. Open interest measures contracts still outstanding.

Read the infographic & sources

Activity is not open exposure. One trade. Two sides. One contract. Volume and open interest differ.

Hypothetical one-contract examples. Each open contract is counted once despite having both a long and a short side.

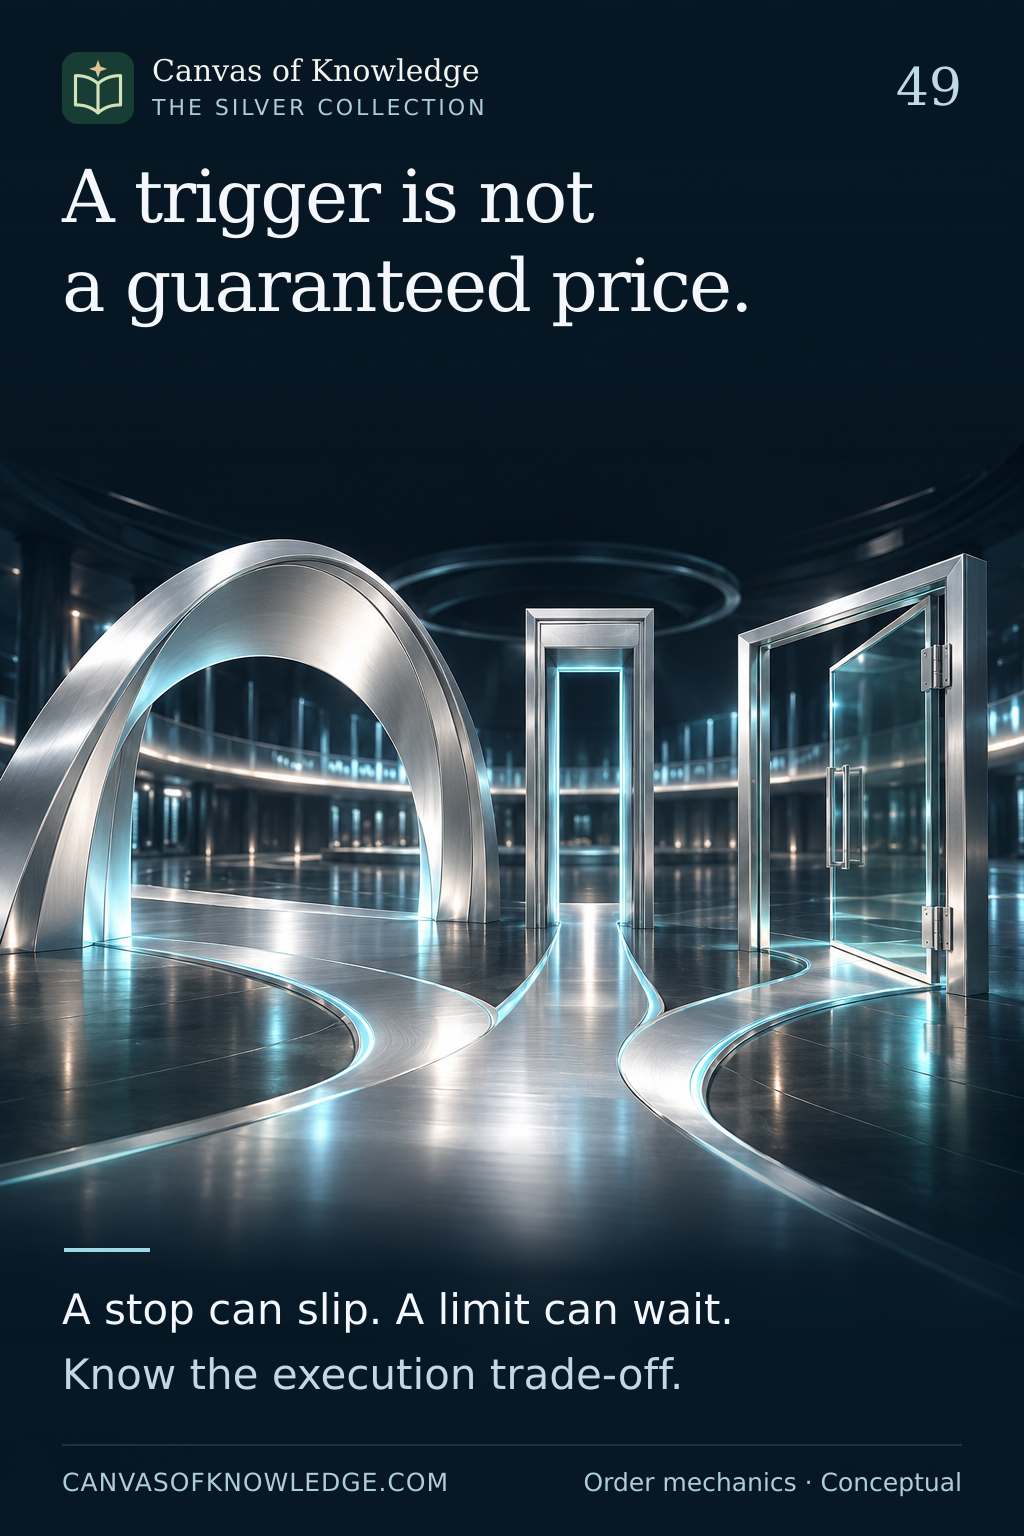
Three architectural gateways and a silver path illustrate different order conditions; the scene is not a market chart.View full infographic
49 / 50

A trigger is not a guaranteed price.

Order instructions determine which execution trade-offs matter when prices move.

Read the infographic & sources

A trigger is not a guaranteed price. A stop can slip. A limit can wait. Know the execution trade-off.

Conceptual execution guide. Order availability and behaviour vary by instrument, venue and broker; no trade is recommended.

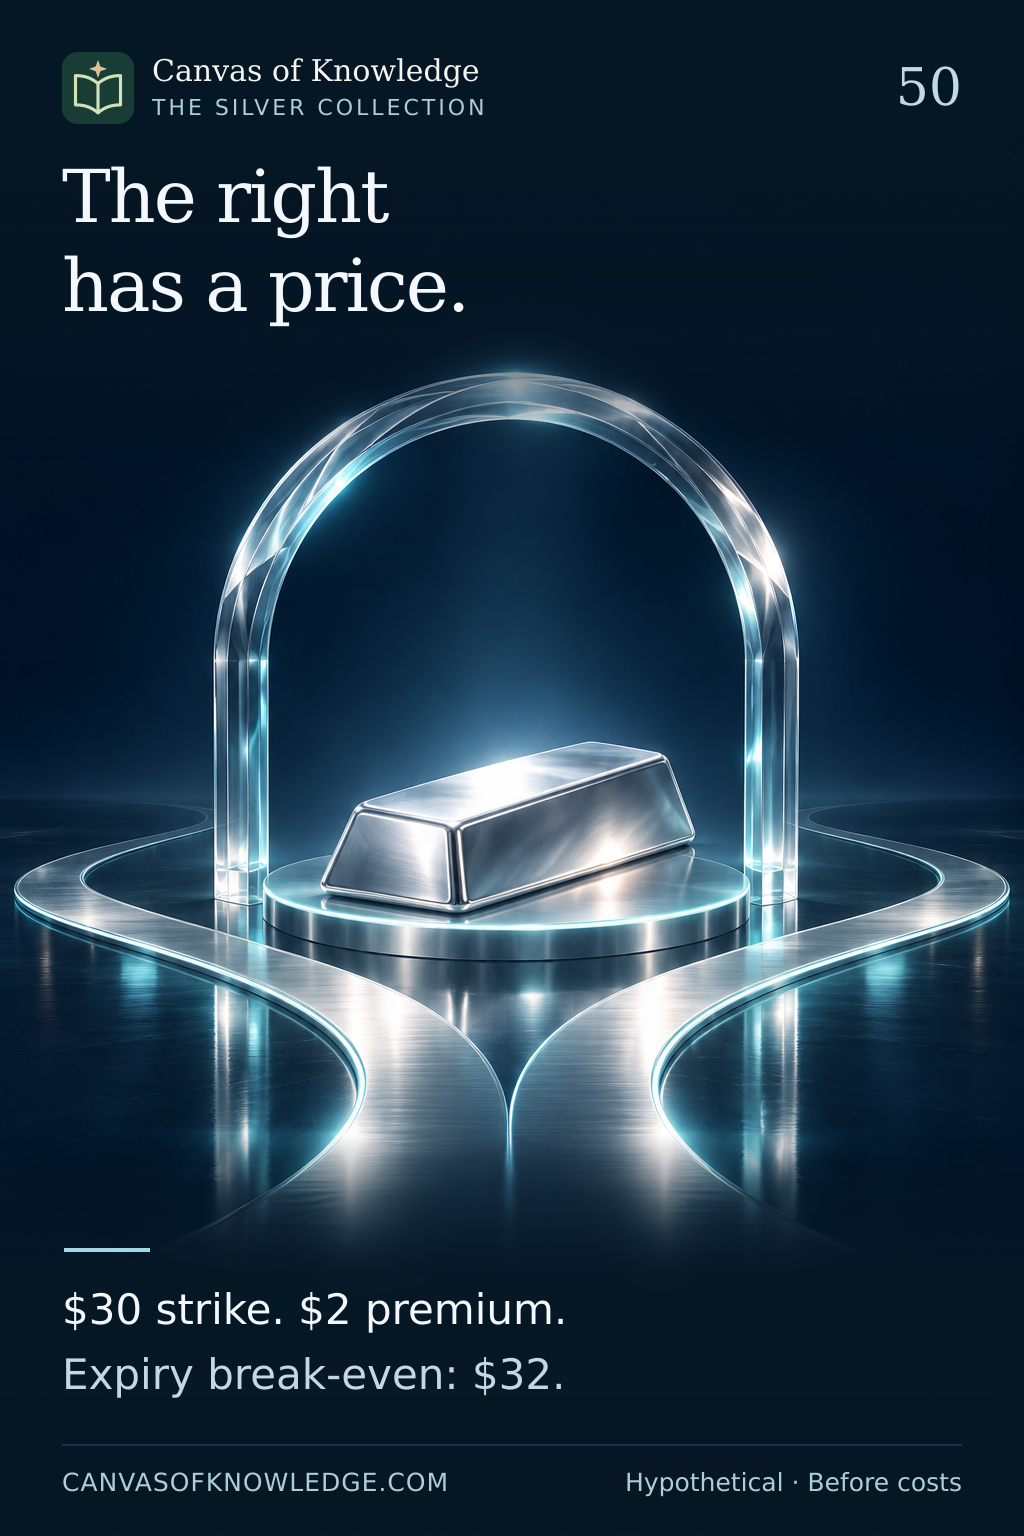
A silver ingot under a transparent arch beside branching paths illustrates the choices and costs associated with an option.View full infographic
50 / 50

The right has a price.

A simple call-option example separates intrinsic value from profit after the premium.

Read the infographic & sources

The right has a price. $30 strike. $2 premium. Expiry break-even: $32.

Entirely hypothetical one-ounce teaching example, not an actual contract size or quote. At expiry: $35 gives $3 net; $29 loses $2; break-even is $32, before costs and tax.

Original artwork · 1,024 × 1,536 px full-resolution downloads · Readable transcripts and source links accompany every poster. The scenes are illustrations, not technical diagrams.

The Silver Collection

The Silver Collection

KEEP THE CONNECTION GOING

Two metals. Different stories.

Continue into the complete Gold collection, or explore the mathematics and ideas behind money.

Explore Gold →Explore Finance →
YOUR COLLECTION

Keep your curiosity.

Saved on this browser. Pick up where your curiosity left off.