← The whole canvasA DEDICATED COLLECTION / GOLD & GOLD TRADING

Beyond
the glitter.

Understand the metal.
Understand the trade.

From the gold in your hand to the risk on your screen. Sixty illustrated posters across six complete chapters, forty companion articles, a world production atlas, twelve core lessons and six interactive tools to bring the metal and its market into focus.

60 illustrated posters12 core lessons6 interactive toolsSources you can follow
NEW ESSAY / 10 MIN READ

Gold: The Enduring
Sovereign of Value

From ancient coinage to modern markets. An interdisciplinary essay by @Jack Ryan.

Read the essay
THE GOLD COLLECTION / 01—60

A closer look at gold.

Sixty illustrated posters. Six chapters. The complete collection—from the metal’s cosmic origins to the responsibilities and risks that come with it.

60 illustrated
posters
CHAPTER 01 / 01—10

Gold essentials

The metal, its properties and the ideas behind its value.

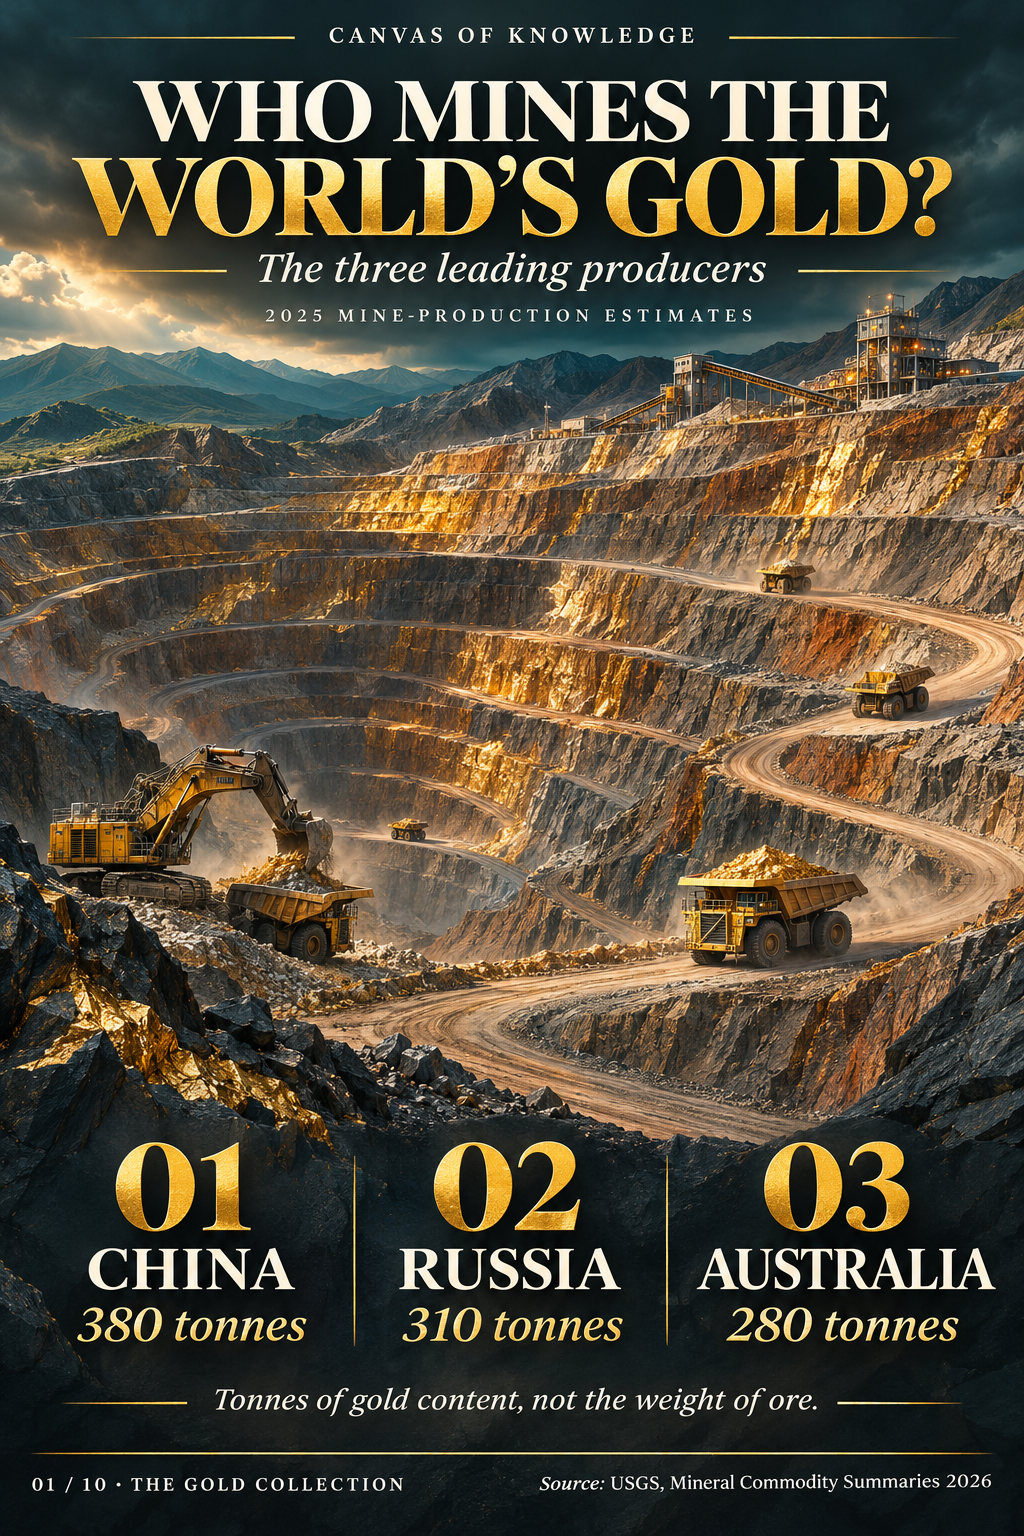
A dramatic terraced mine illustrates the three leading producers: China, Russia and Australia.View full infographic
01 / 60

Who mines the world’s gold?

The countries behind the metal.

Read the infographic & sources

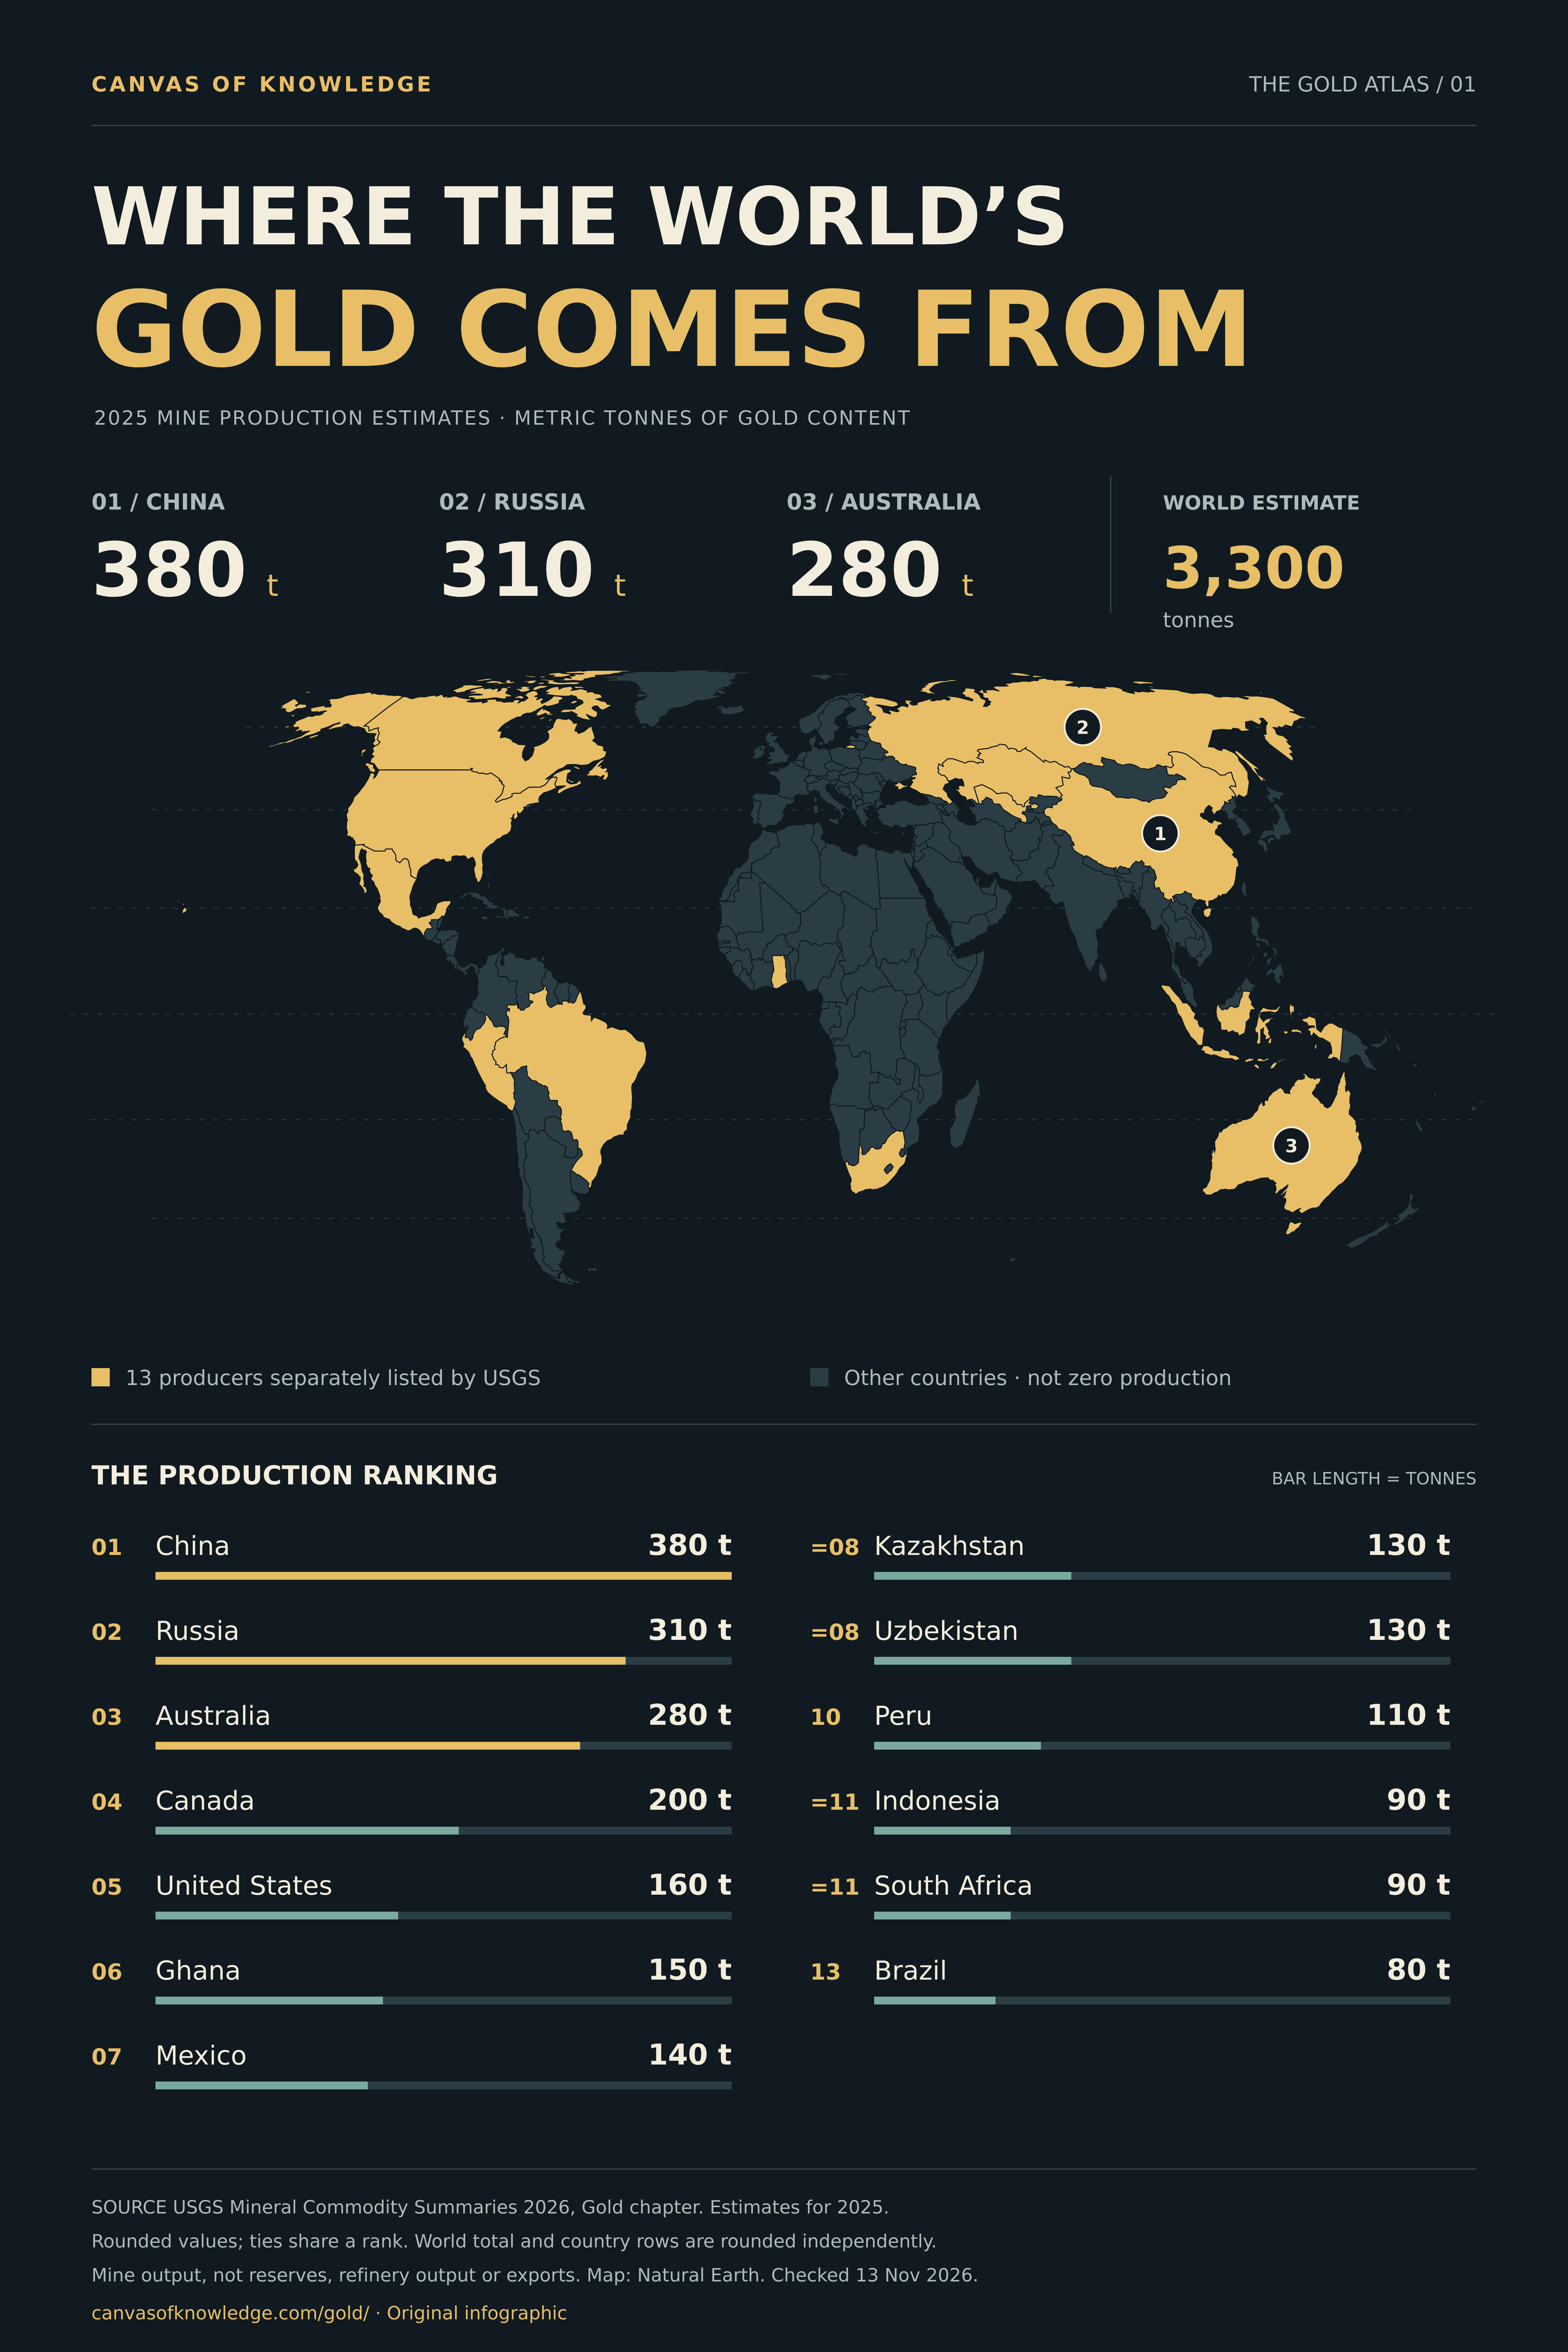
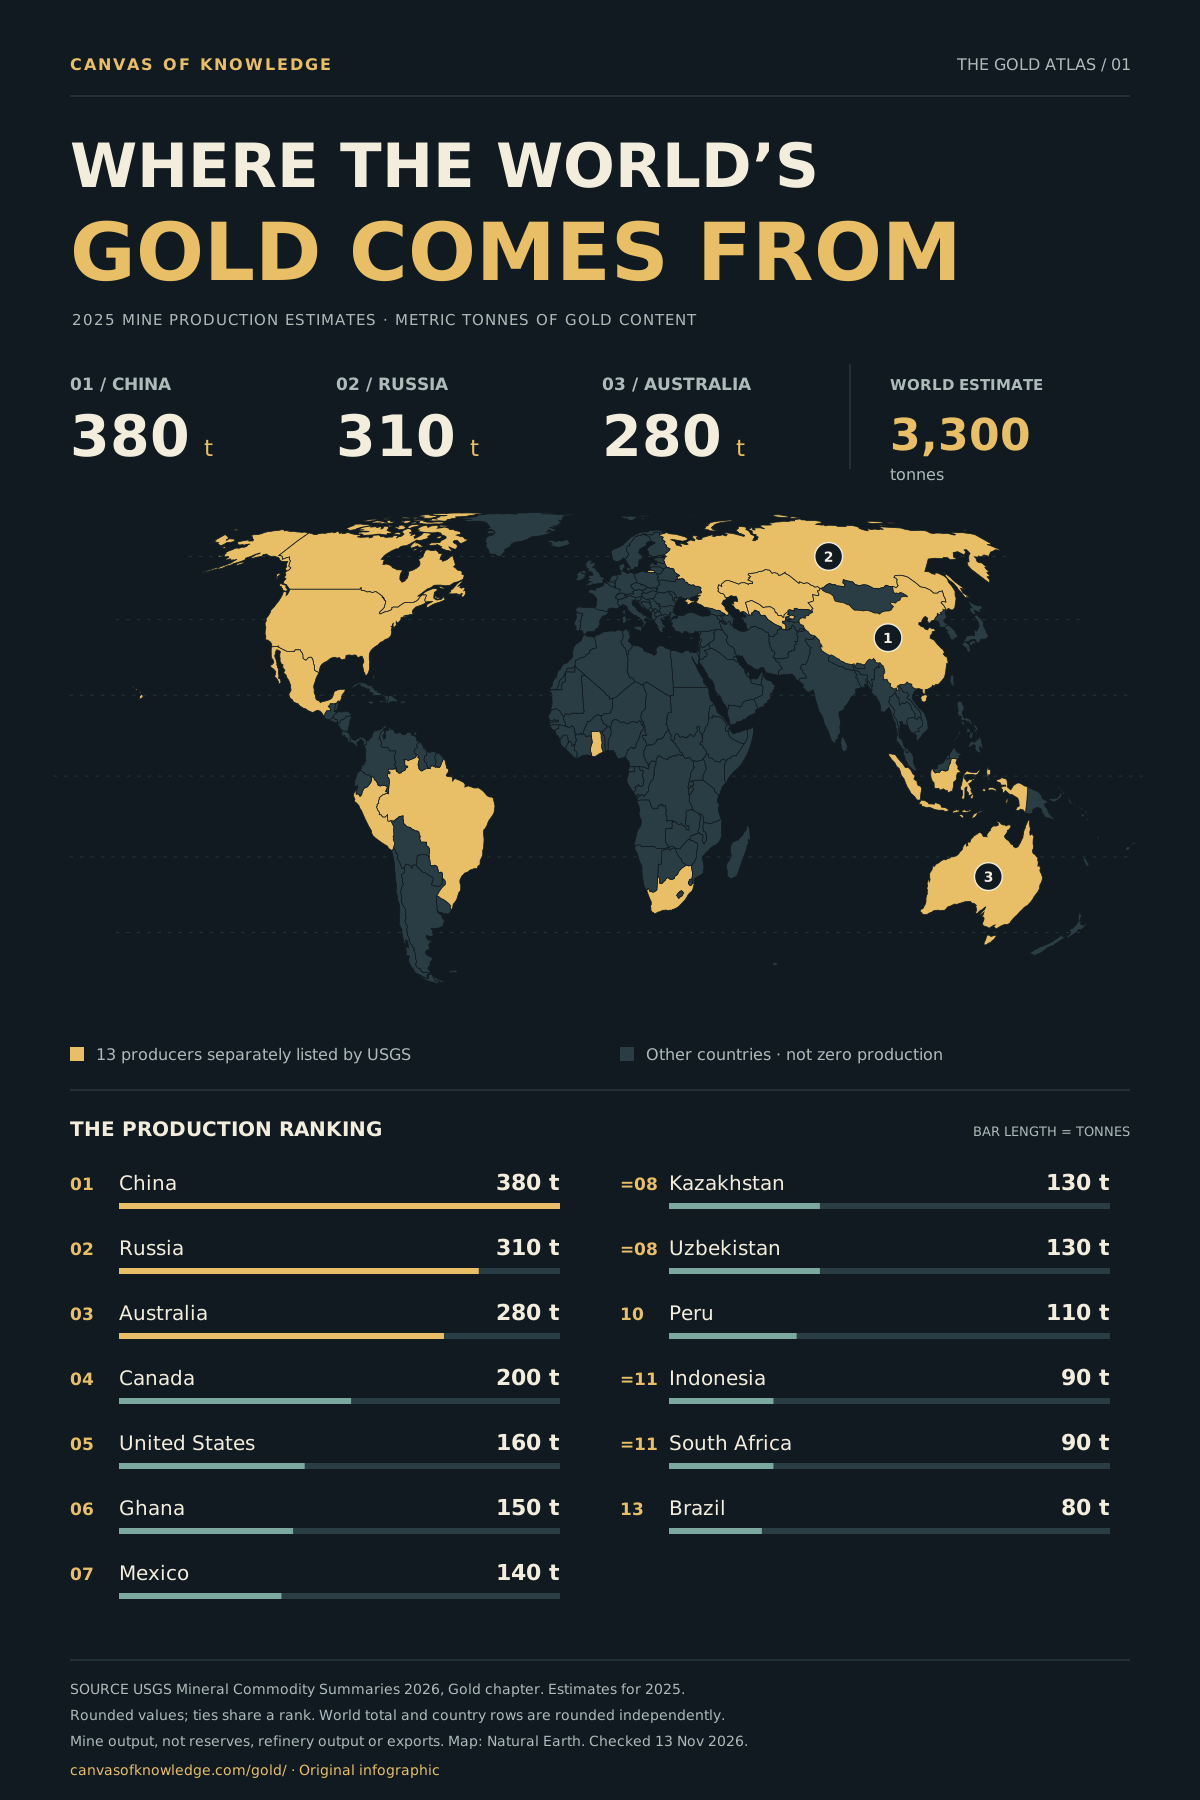
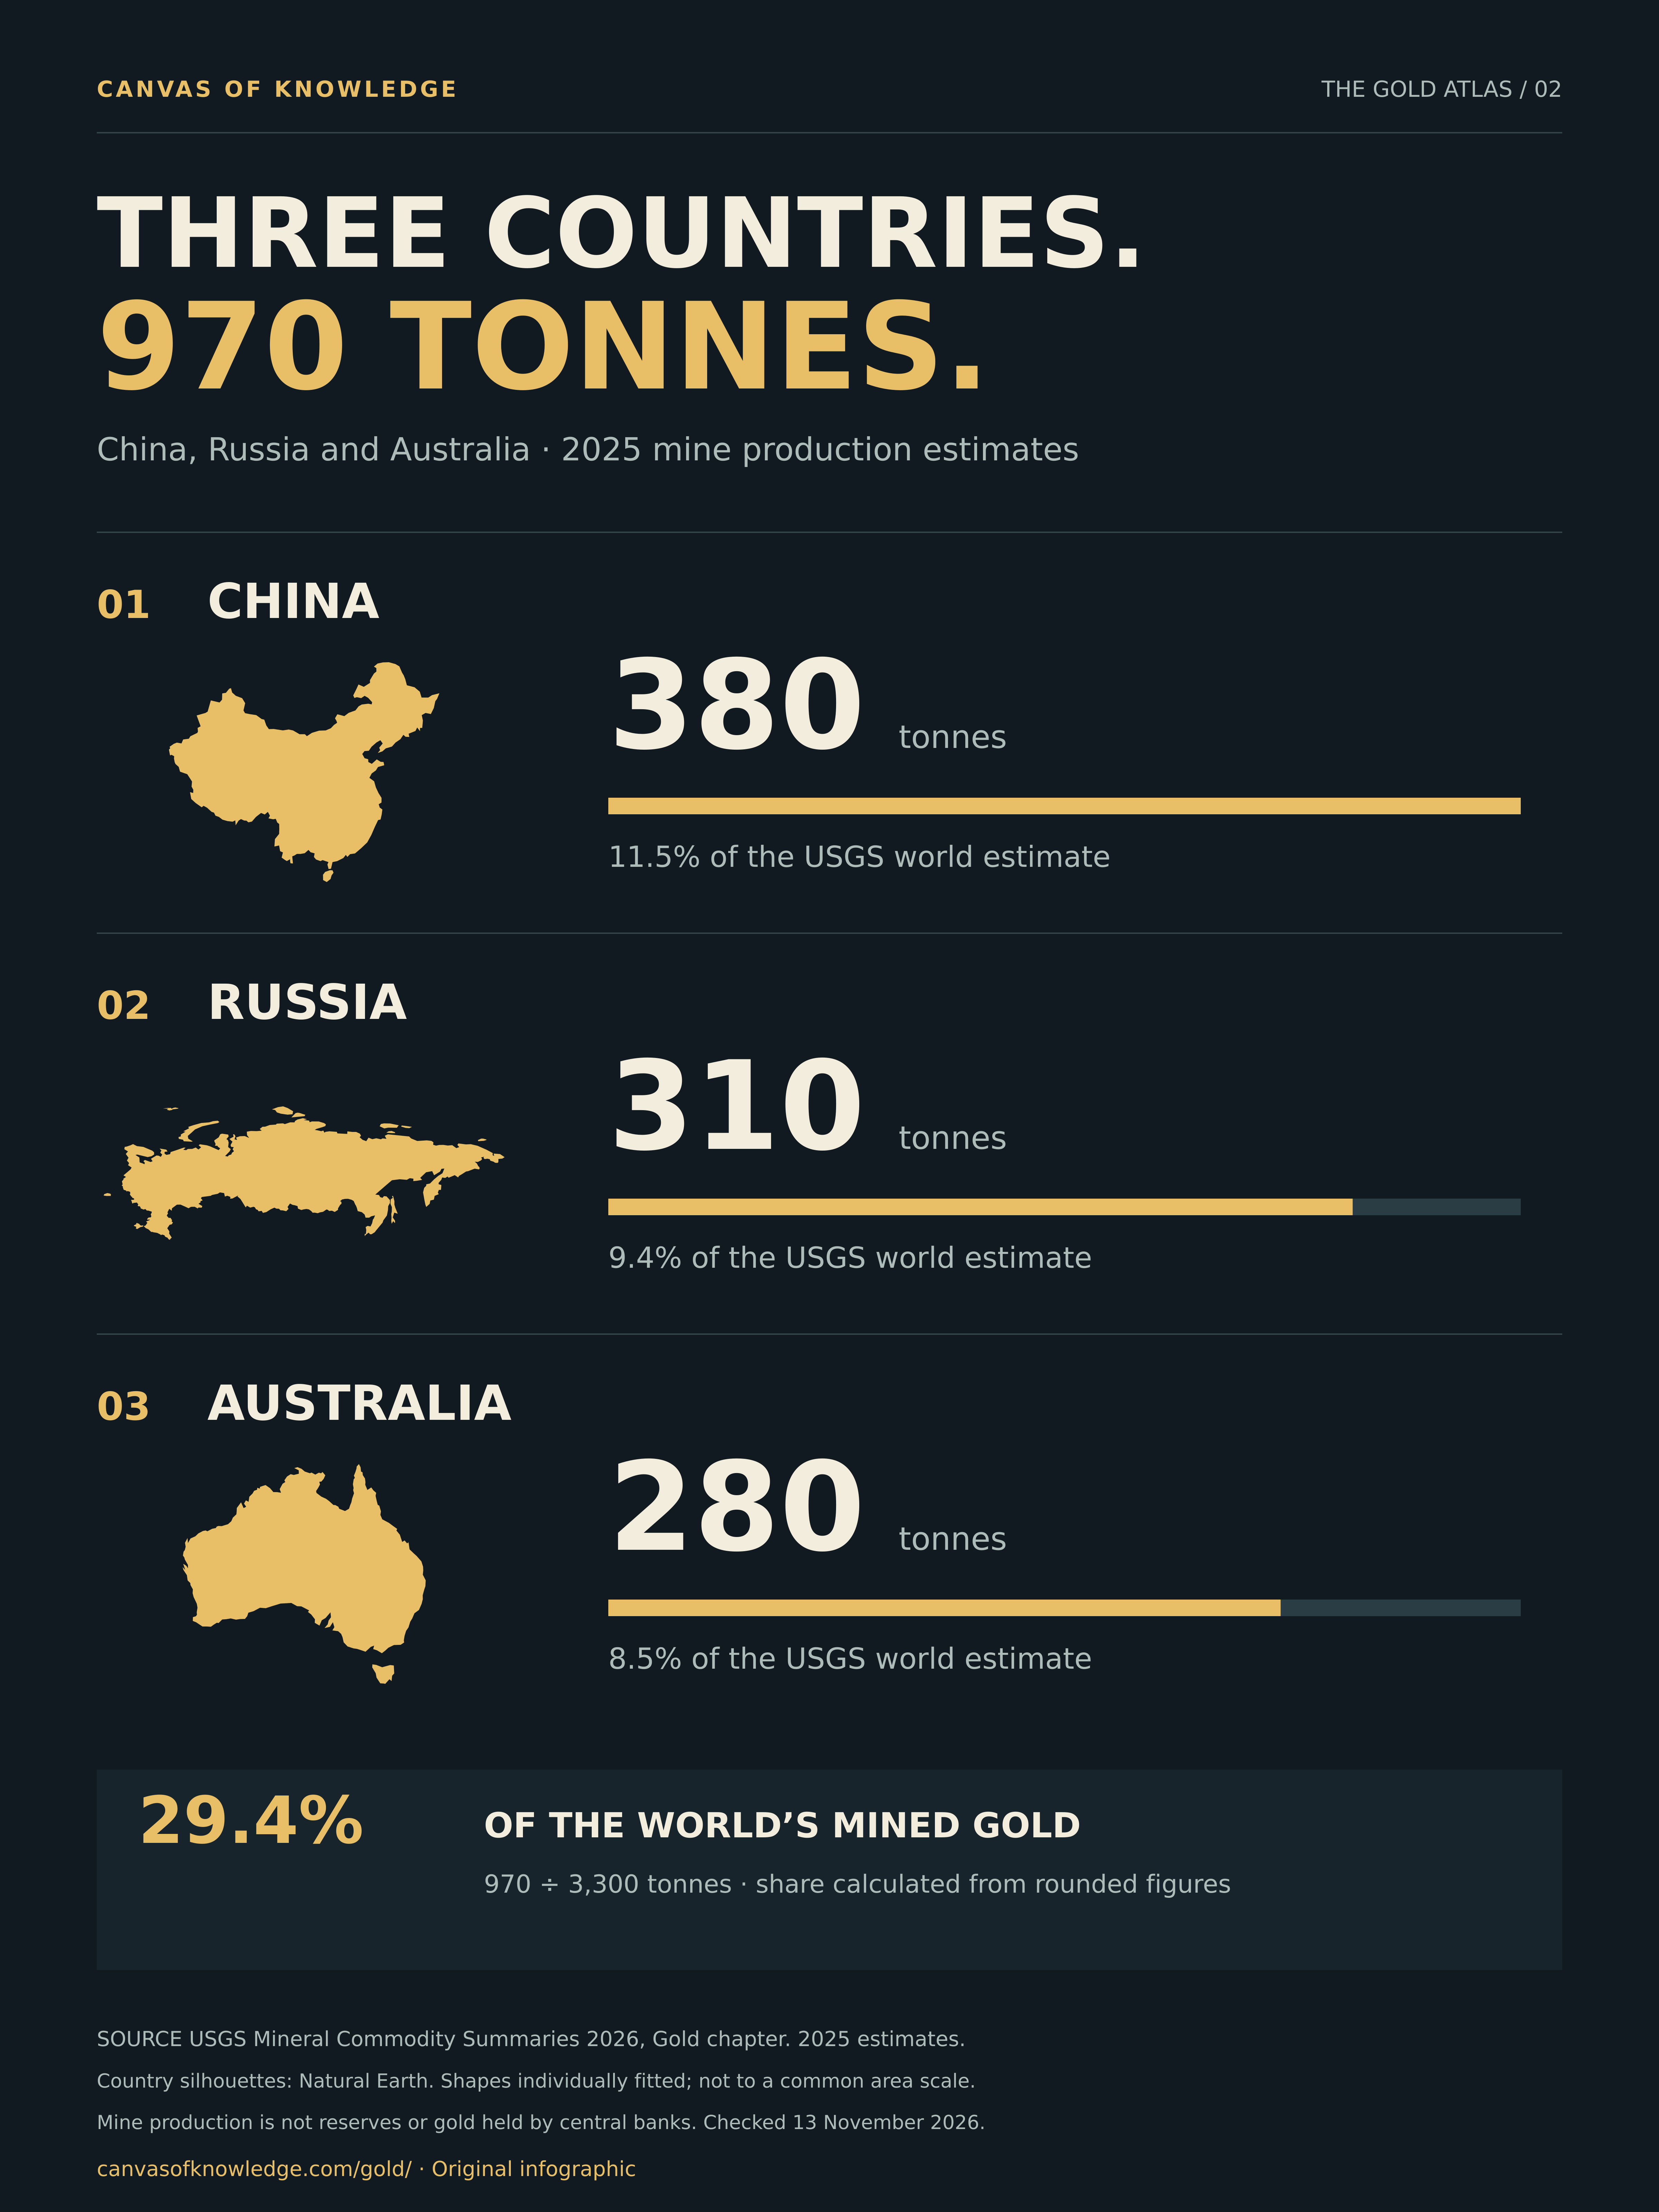
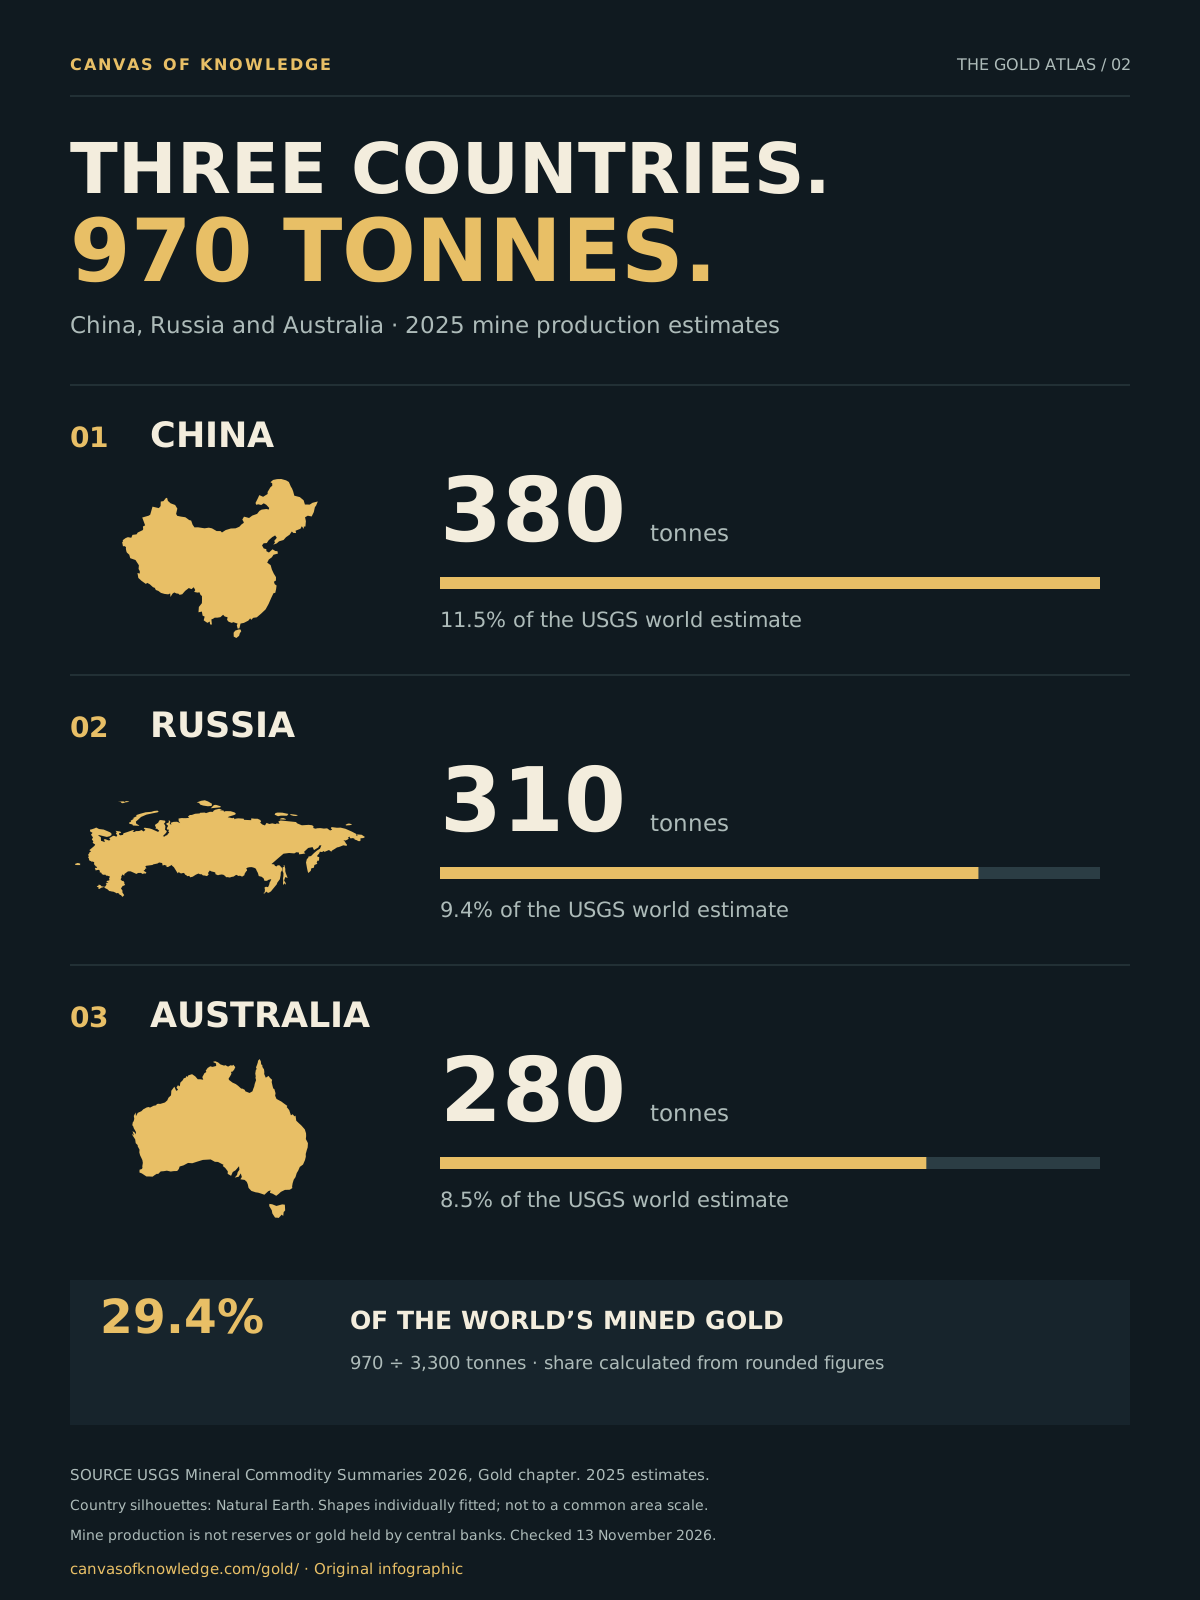
USGS estimates 2025 mine production at 380 tonnes for China, 310 for Russia and 280 for Australia, the three leading producers. These are metric tonnes of gold content, not the weight of ore.

2025 estimates. The mining scene is illustrative; visible gold is exaggerated to tell the story.
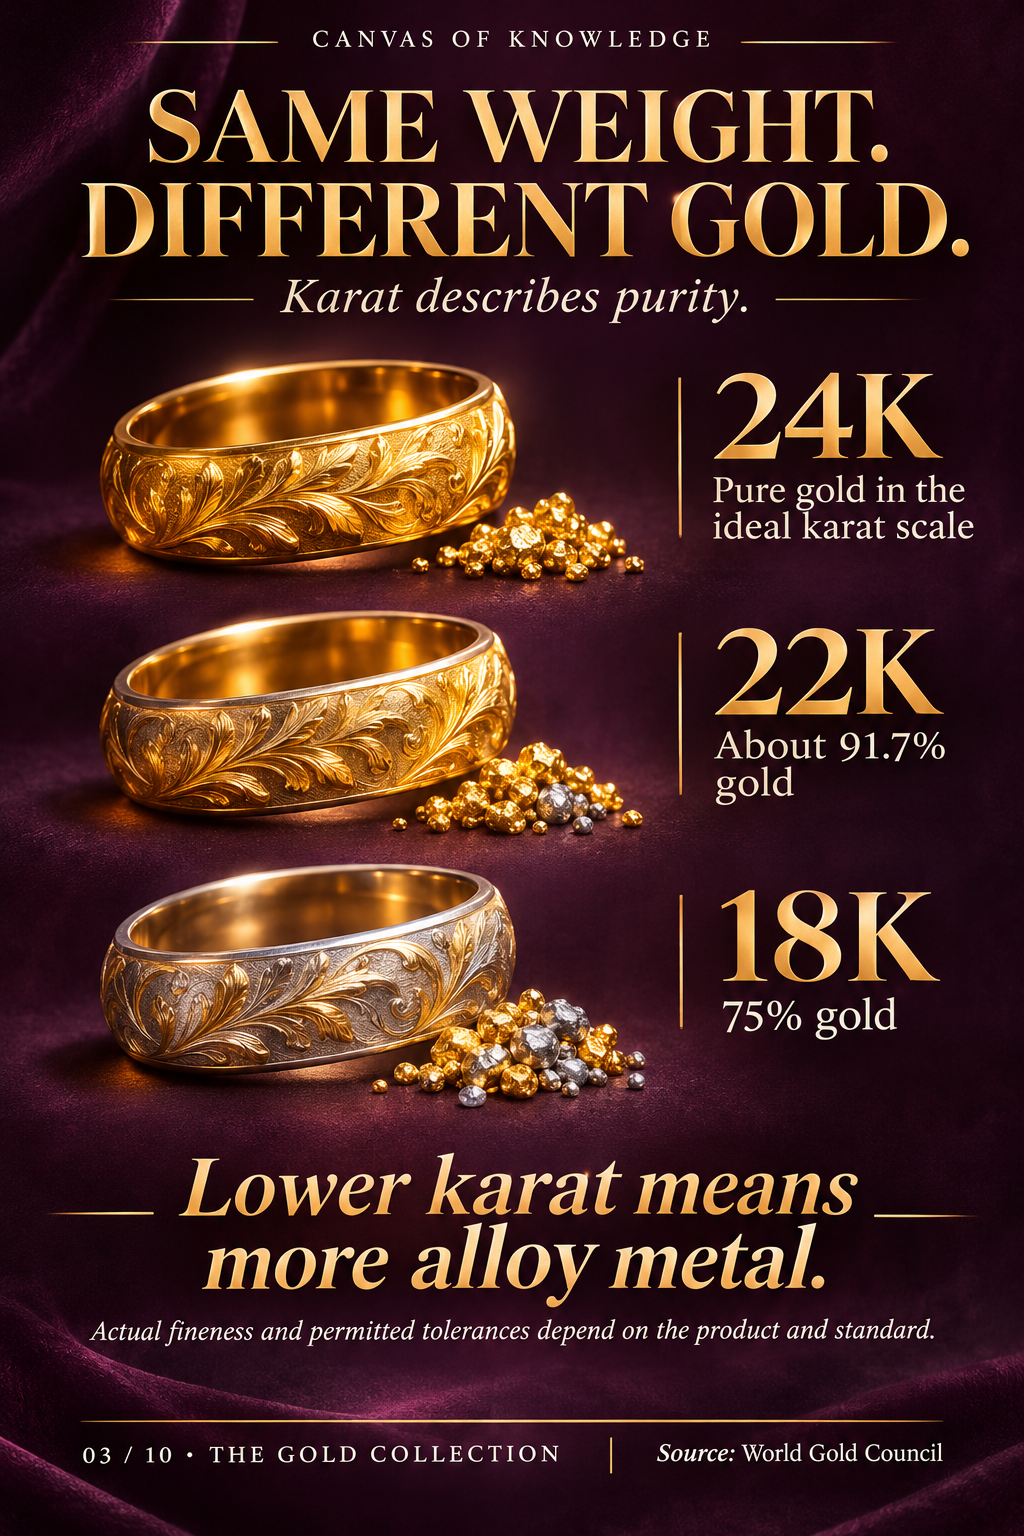
Three illustrated rings compare 24K, 22K and 18K gold purity.View full infographic
03 / 60

Same weight. Different gold.

Understand the gold inside the alloy.

Read the infographic & sources

On the ideal karat scale, 24K is pure gold, 22K is about 91.7% gold and 18K is 75% gold by mass. Lower karat means more alloy metal.

Actual fineness and permitted tolerances depend on the product and standard. Colour alone does not establish purity; the rings and granules are illustrative.

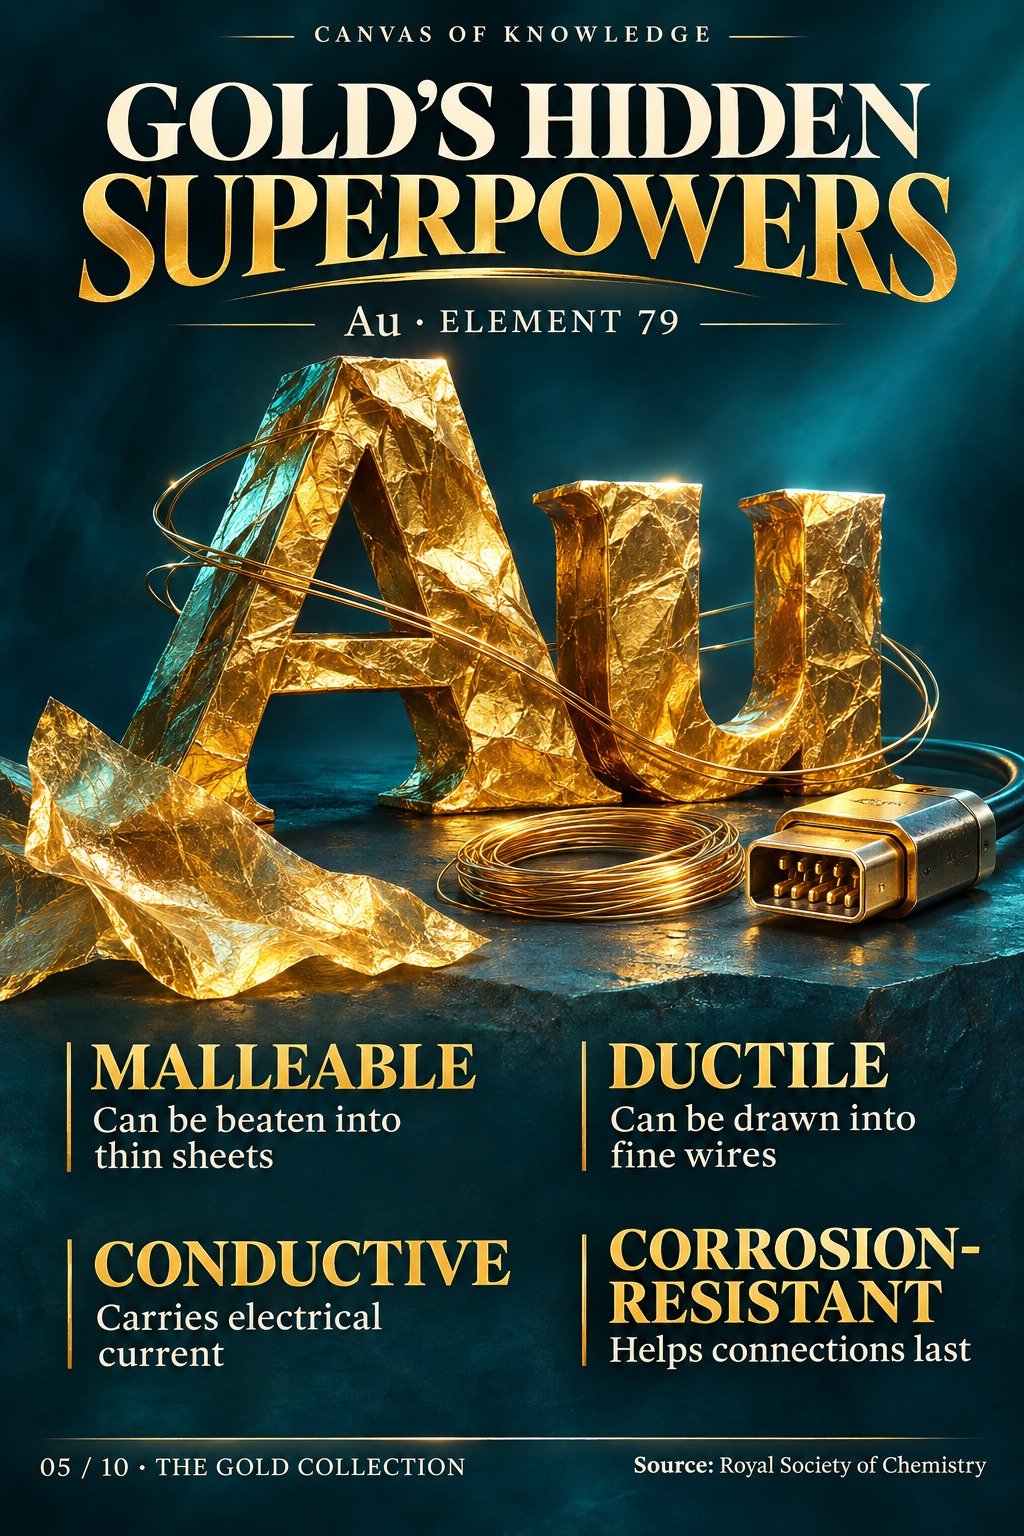
Gold foil, wire and a connector surround a sculptural Au symbol to illustrate gold’s material properties.View full infographic
05 / 60

Gold’s hidden superpowers

The properties behind its usefulness.

Read the infographic & sources

Au is gold’s chemical symbol; its atomic number is 79. Gold is malleable, so it can be beaten into thin sheets; ductile, so it can be drawn into fine wires; electrically conductive; and corrosion-resistant.

The sculpture is a conceptual illustration, not an atomic model. Gold is corrosion-resistant, not chemically indestructible.

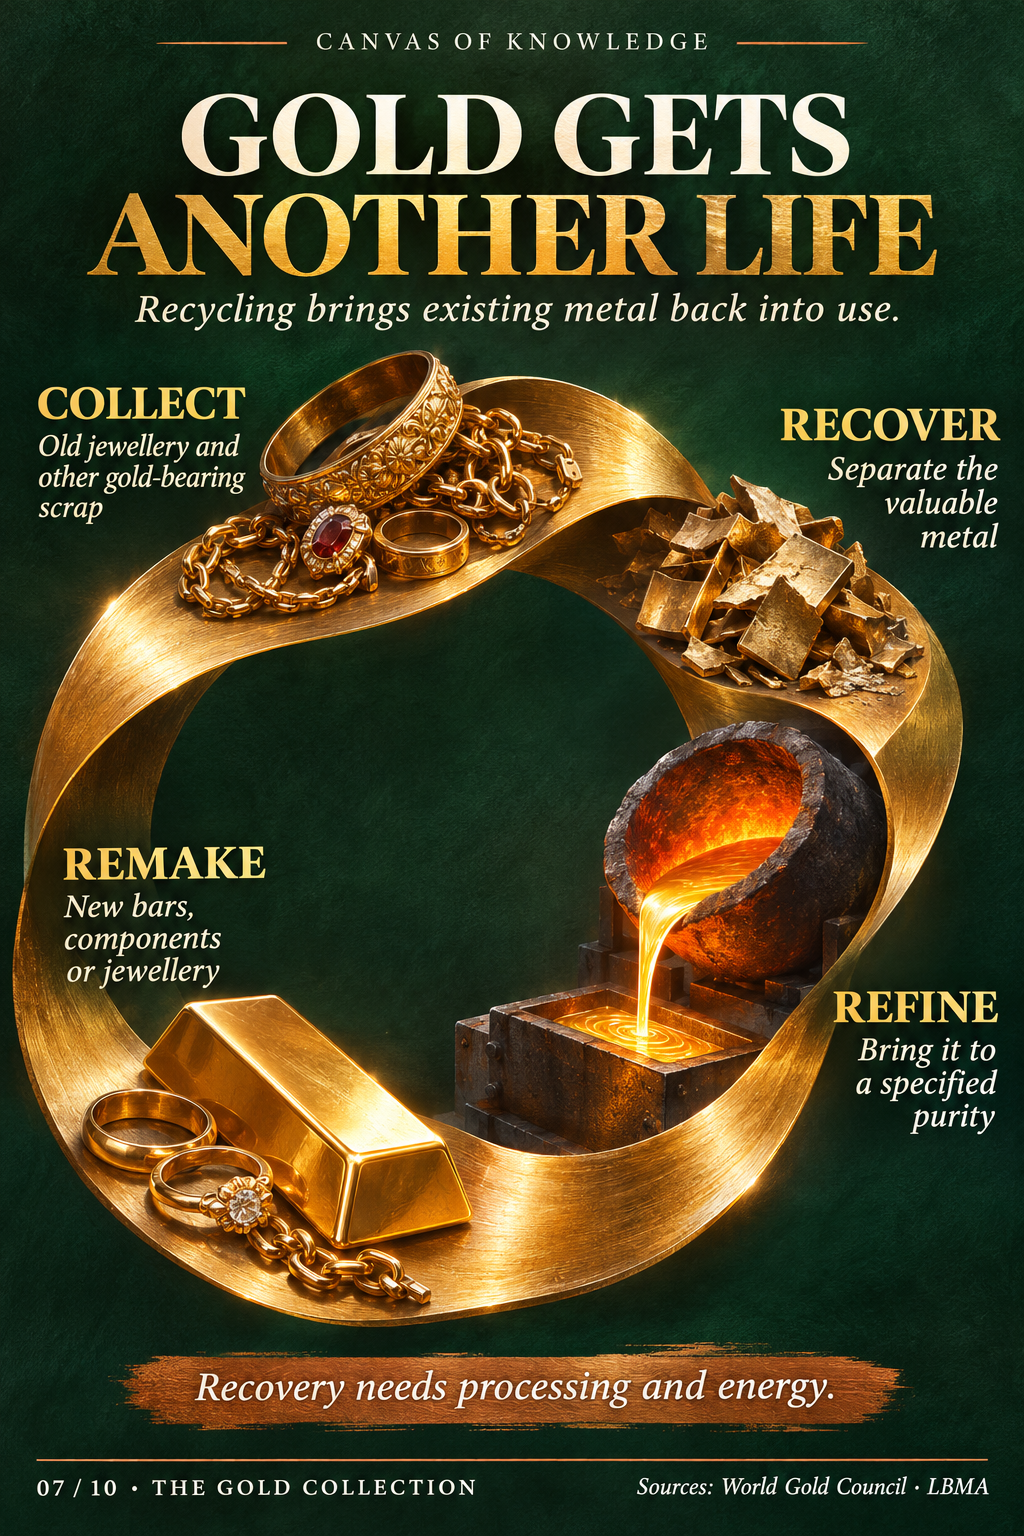
A gold ribbon loops through old jewellery, scrap, a crucible and remade gold products.View full infographic
07 / 60

Gold gets another life

The metal’s next chapter.

Read the infographic & sources

Recycling brings existing metal back into use. Gold-bearing materials are collected, valuable metal is recovered, it is refined to a specified purity, and it can be made into new bars, components or jewellery.

Recovery needs processing and energy. This illustration does not imply loss-free or impact-free recycling.

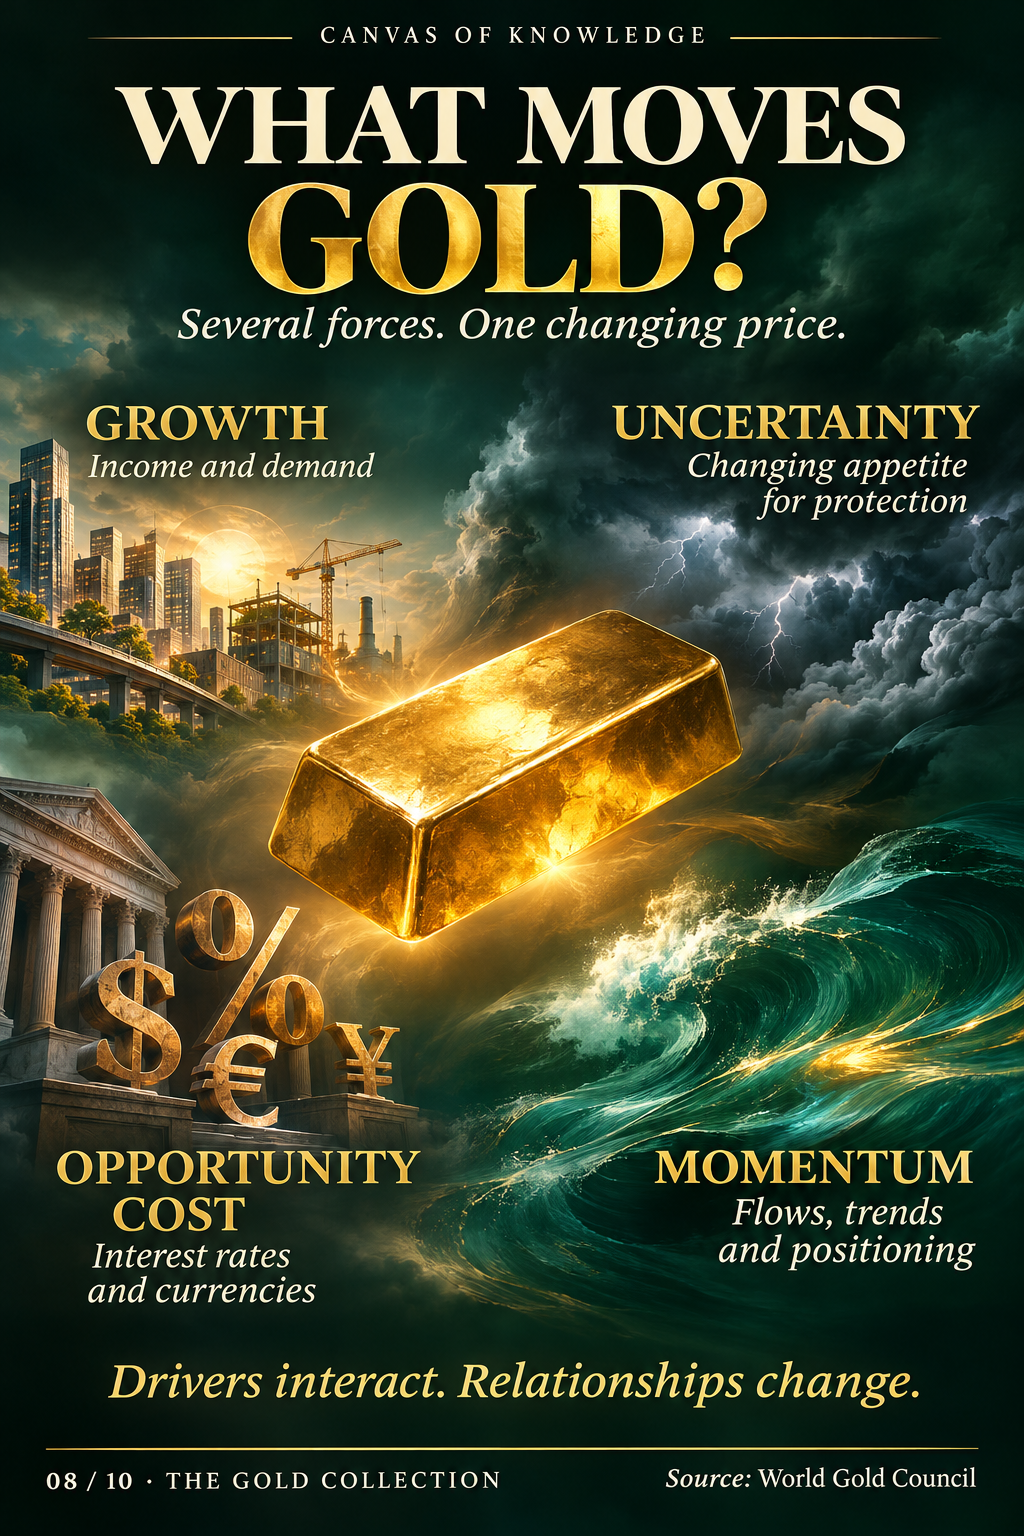
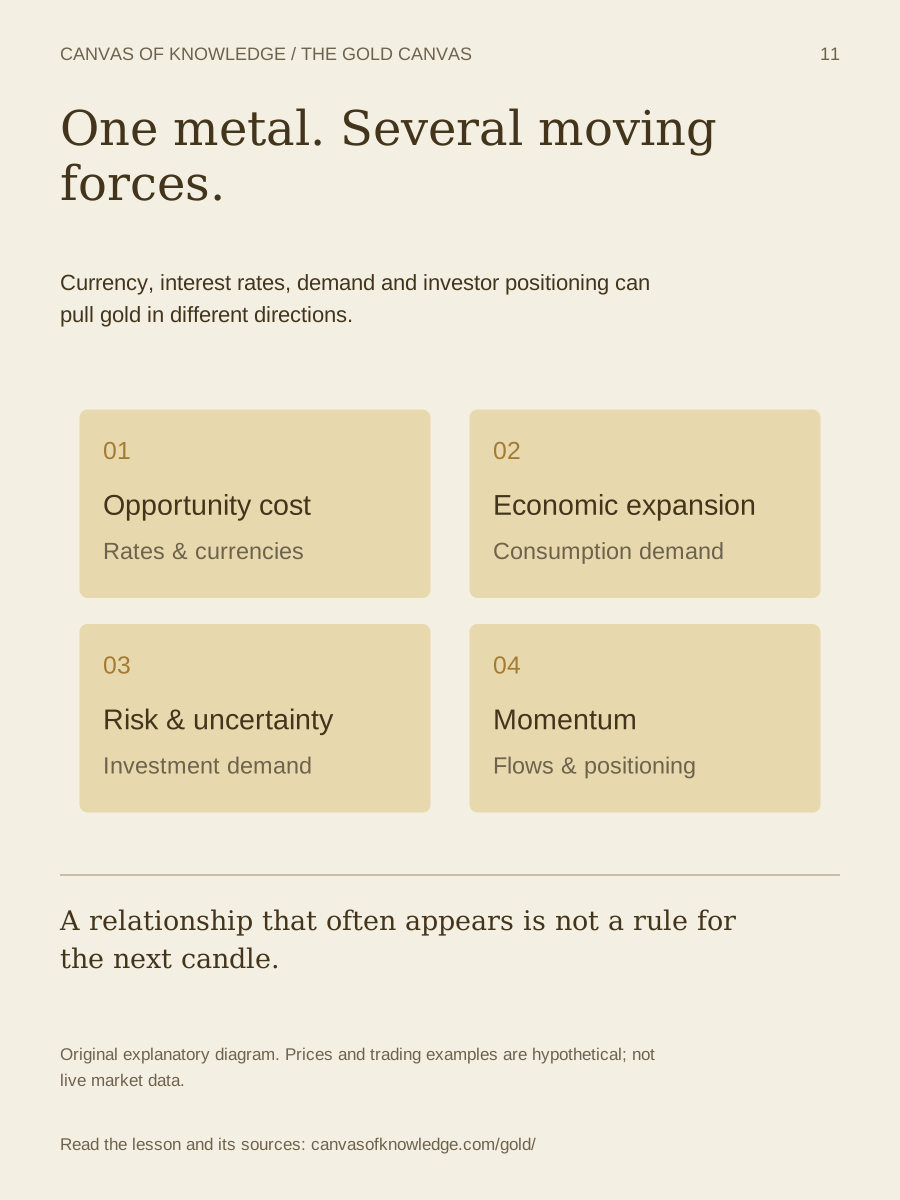
A central gold bar is surrounded by symbols of growth, uncertainty, interest rates, currencies and momentum.View full infographic
08 / 60

What moves gold?

Several forces. One changing price.

Read the infographic & sources

Gold’s price responds to interacting forces. Economic growth affects income and demand. Uncertainty can change demand for protection. Interest rates and currencies influence opportunity cost. Flows, trends and positioning contribute to momentum.

Relationships change. The artwork is a conceptual illustration, not a forecast or trading signal.

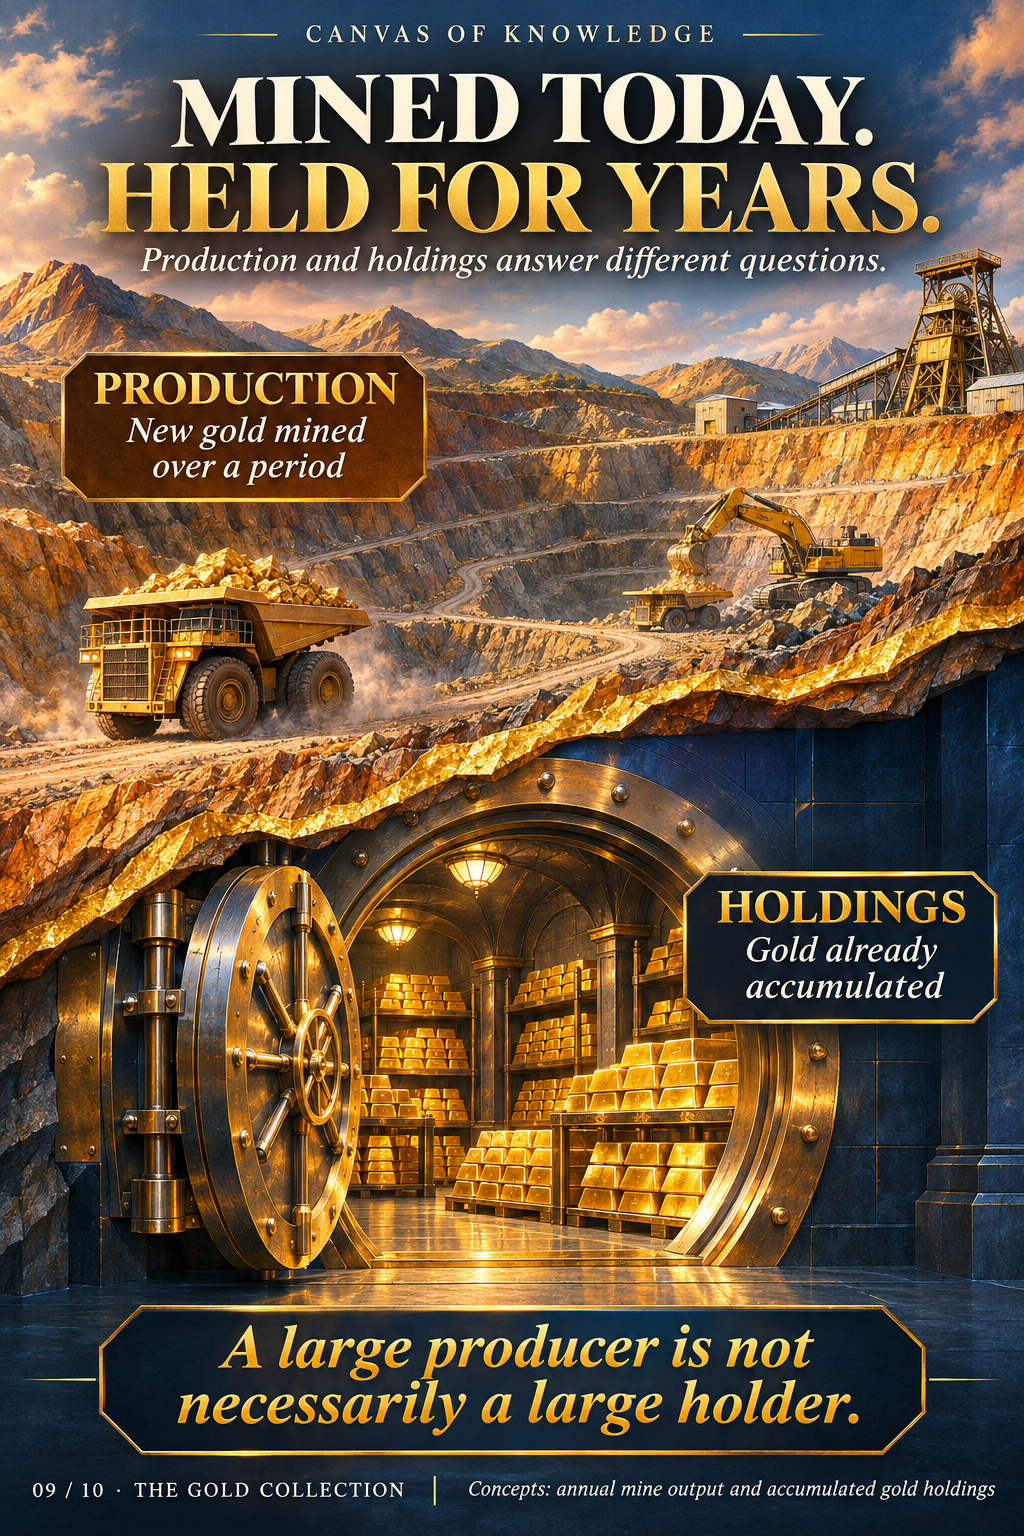
An illustrated mine above a gold-filled vault contrasts annual mine output with accumulated holdings.View full infographic
09 / 60

Mined today. Held for years.

A flow of new metal. A stock already held.

Read the infographic & sources

Production is new gold mined over a period. Holdings are gold already accumulated. A large producer is not necessarily a large holder.

The mine and vault are a visual metaphor. Their sizes and the number of bars do not encode quantities.

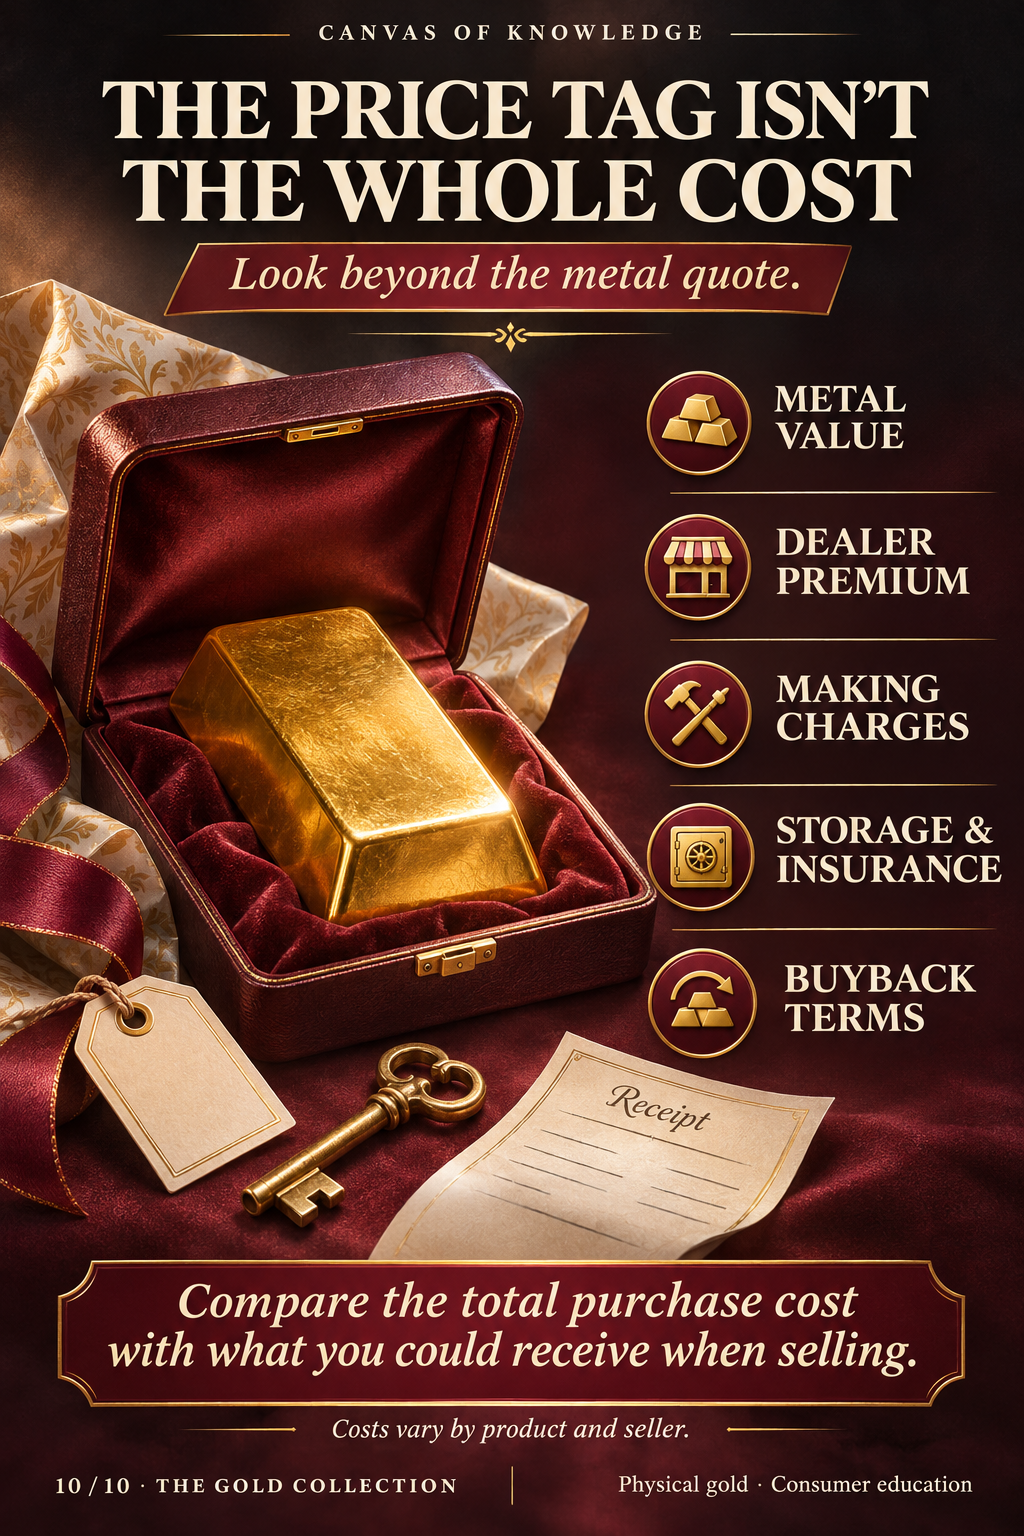
A gold bar in a presentation case illustrates metal value, premiums, making charges, storage, insurance and buyback terms.View full infographic
10 / 60

The price tag isn’t the whole cost

Look beyond the metal quote.

Read the infographic & sources

Consider metal value, dealer premiums, making charges, storage and insurance, and buyback terms. Compare the total purchase cost with what you could receive when selling.

Costs vary by product and seller; not every listed cost applies to every purchase. This is consumer education, not a recommendation to buy gold.

CHAPTER 02 / 11—20

The world of gold

Remarkable gold regions, hidden deposits and the journey from discovery to market.

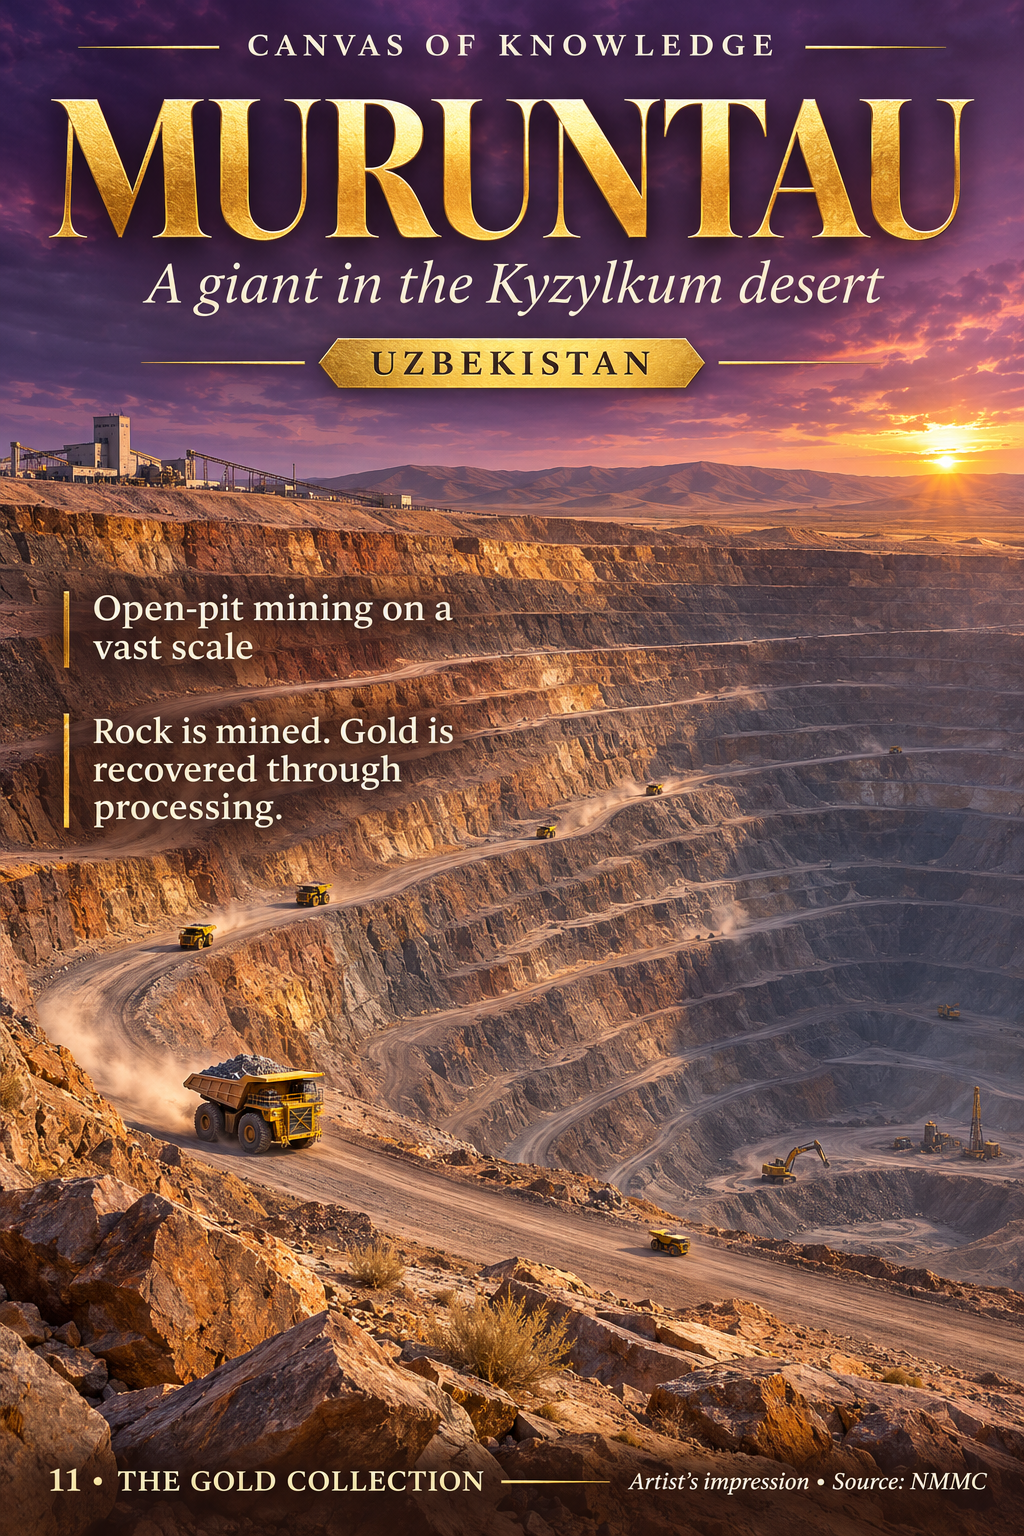
An artist’s impression of a vast terraced open-pit mine in the Kyzylkum desert, with haul trucks and a violet sunset.View full infographic
11 / 60

Muruntau: a desert giant

The scale of a mine. The work behind the metal.

Read the infographic & sources

Muruntau lies in Uzbekistan’s Kyzylkum desert. Its open pit extracts gold-bearing rock that must be processed to recover the metal. A large excavation and the gold ultimately recovered are very different things.

Artist’s impression, not a photograph or survey of the mine. The artwork does not specify a production rank, current dimensions or output.

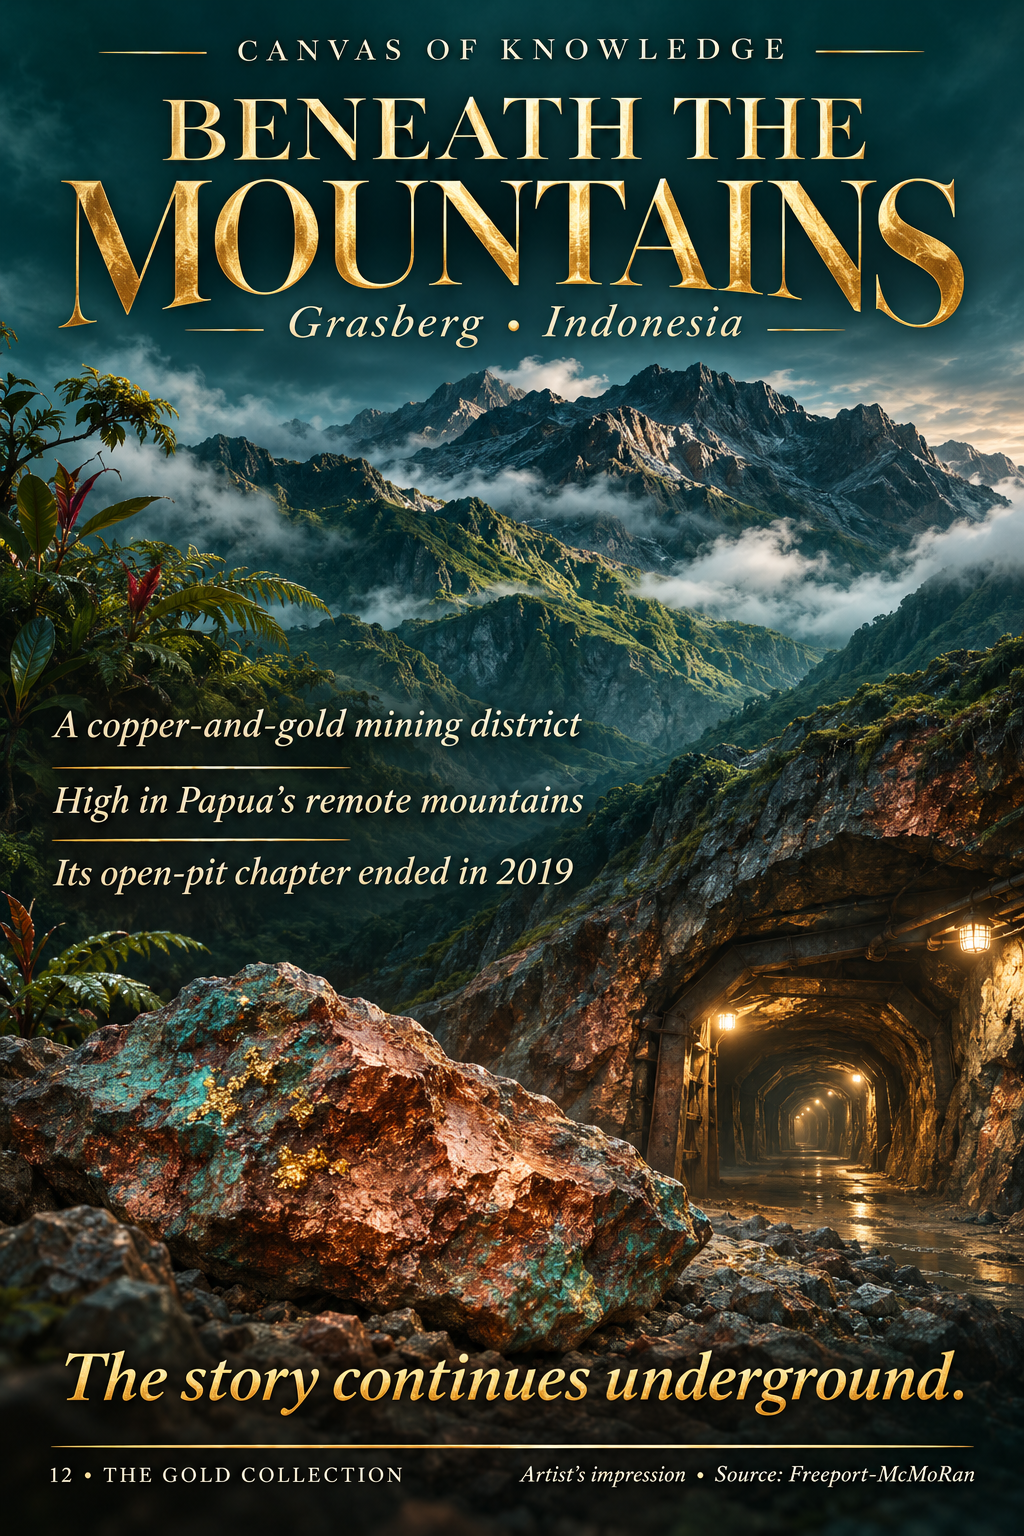
An illustrative Papua mountain landscape blends into an underground mine entrance, with a copper-toned mineral specimen in the foreground.View full infographic
12 / 60

Grasberg: beneath the mountains

Copper and gold share a remarkable setting.

Read the infographic & sources

The Grasberg minerals district is in the remote mountains of Papua, Indonesia. It contains copper and gold. Open-pit production at Grasberg ended in 2019; the district’s mining story continued underground.

The scene and specimen are illustrative, not a mine plan or an actual mineral sample. Visible metallic flecks are exaggerated: the operator notes that gold is rarely visible to the naked eye in these ores. This is not a report of today’s operating status.

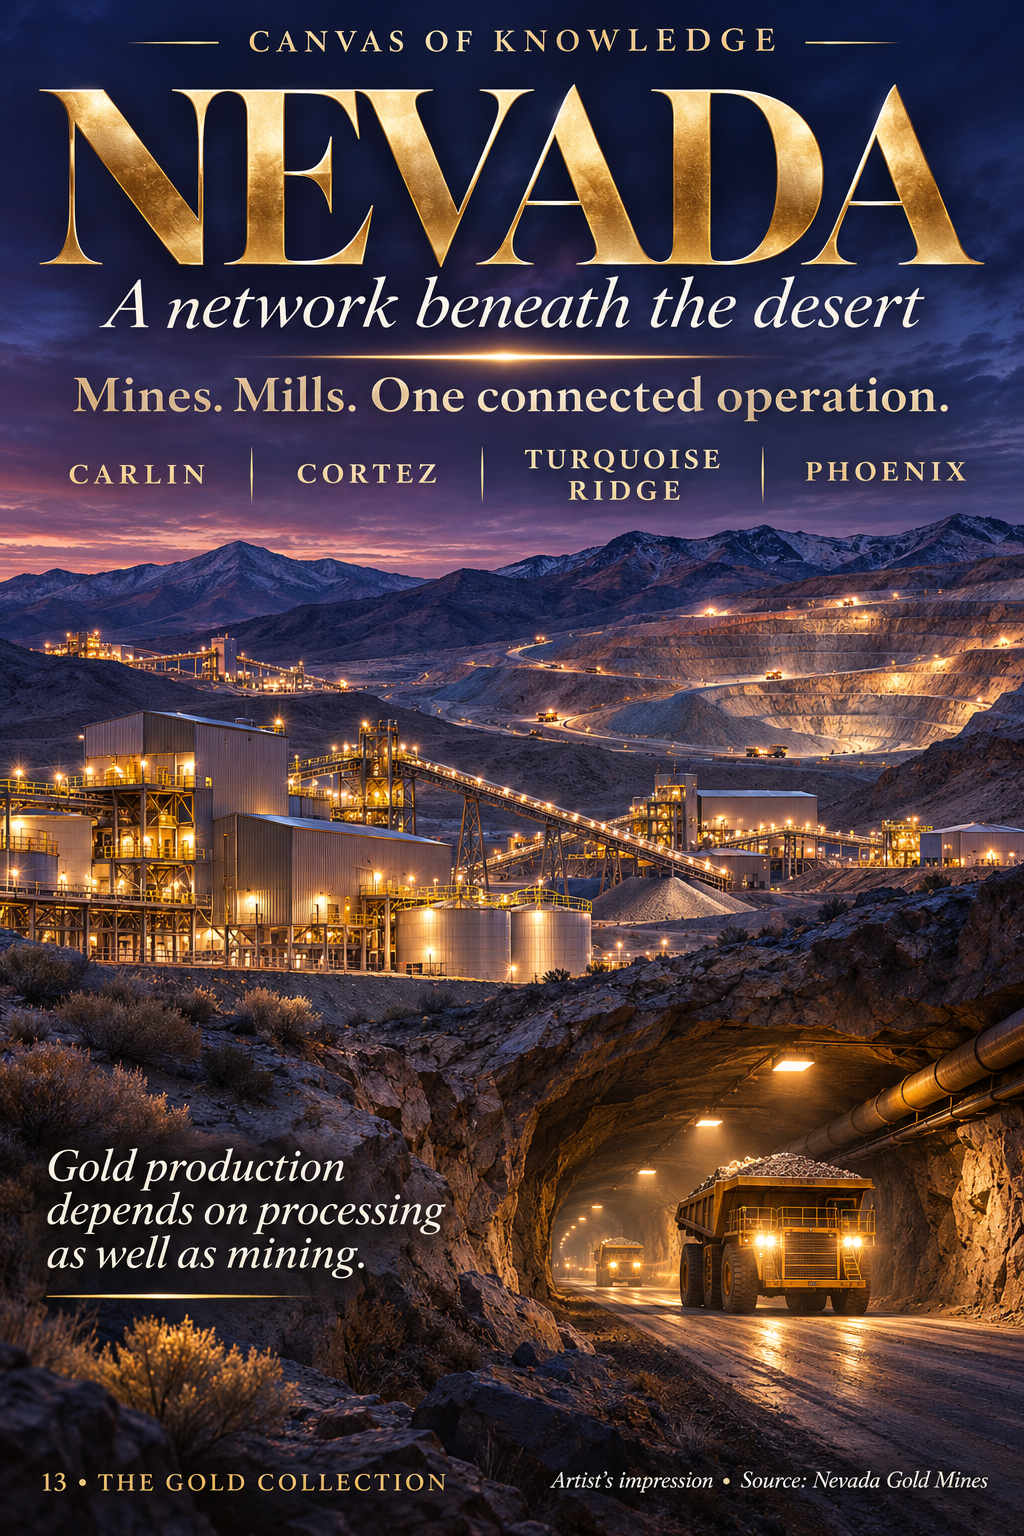
An imagined Nevada mining landscape at blue hour, with illuminated processing buildings, pit terraces and an underground corridor.View full infographic
13 / 60

Nevada: a network beneath the desert

A mine is only part of the operation.

Read the infographic & sources

Nevada Gold Mines connects mines and processing facilities across Carlin, Cortez, Turquoise Ridge and Phoenix. Different ores can require different treatment routes. Processing capacity and coordination matter alongside the rock being mined.

The continuous scene is an artistic composite of several kinds of infrastructure. It does not show real distances, facility locations, underground connections or a current operating schedule.

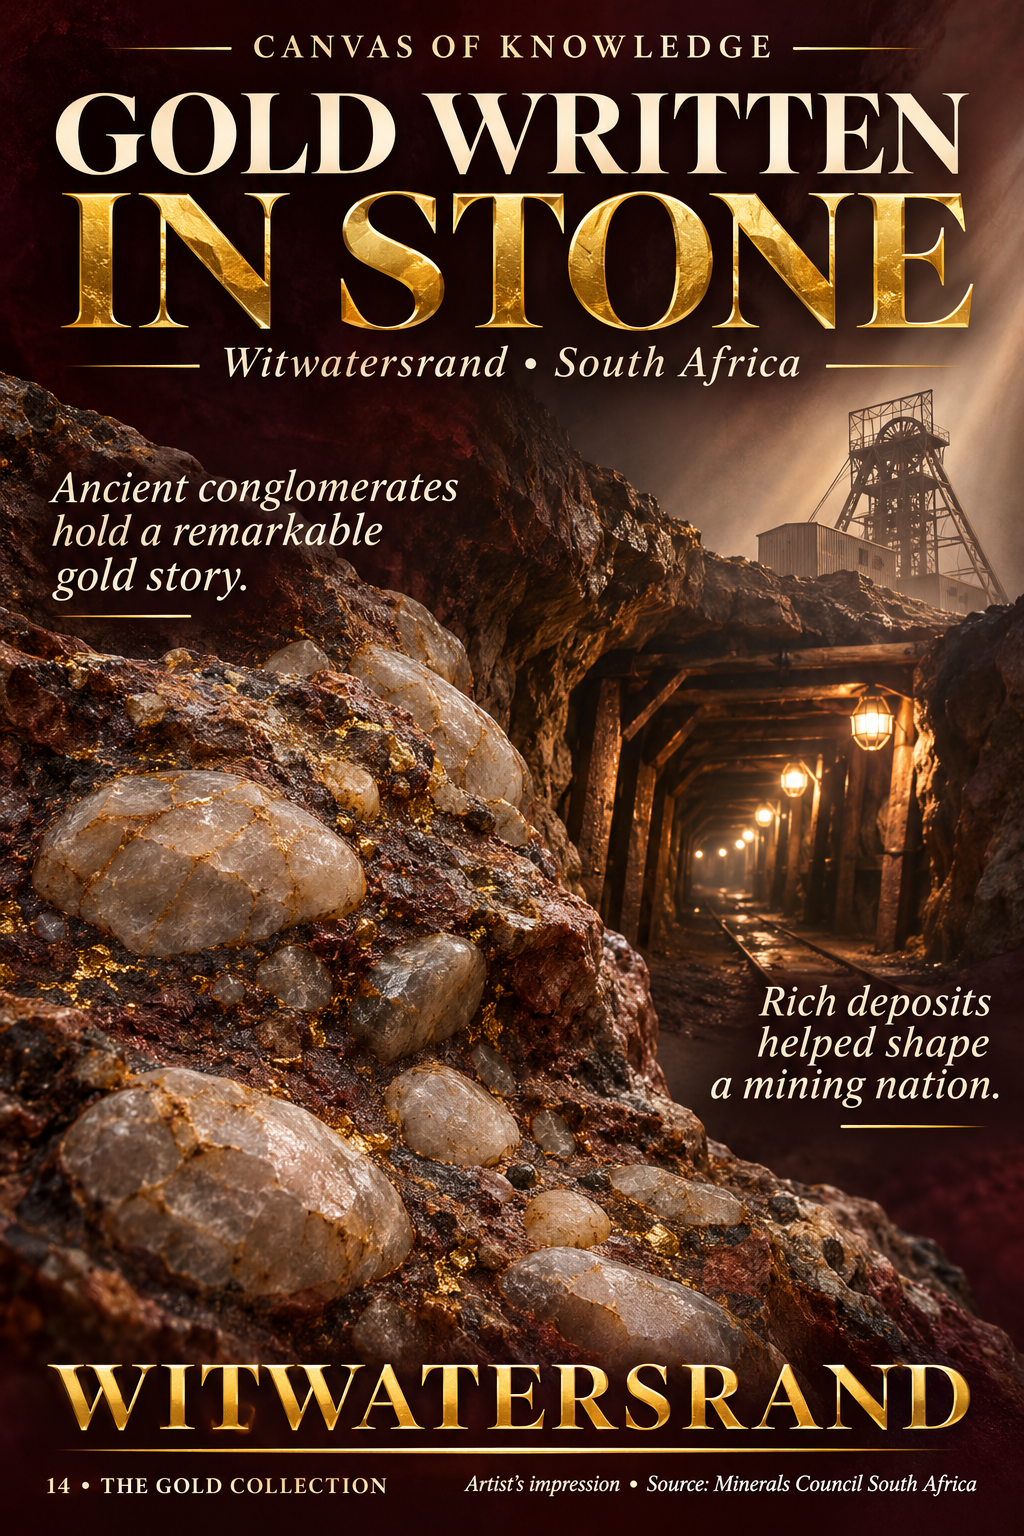
A quartz-pebble conglomerate specimen fills a burgundy and charcoal illustration, blending into a deep mine corridor and distant headframe.View full infographic
14 / 60

Witwatersrand: gold written in stone

Ancient geology helped shape a mining nation.

Read the infographic & sources

South Africa’s Witwatersrand Basin hosts gold-bearing conglomerates: rocks containing rounded pebbles within a finer matrix. Its deposits played a major role in South Africa’s mining history and the development of Johannesburg.

Illustrative geology and mine setting, not a measured section. Metallic highlights do not indicate a specimen’s grade. No current production ranking is implied.

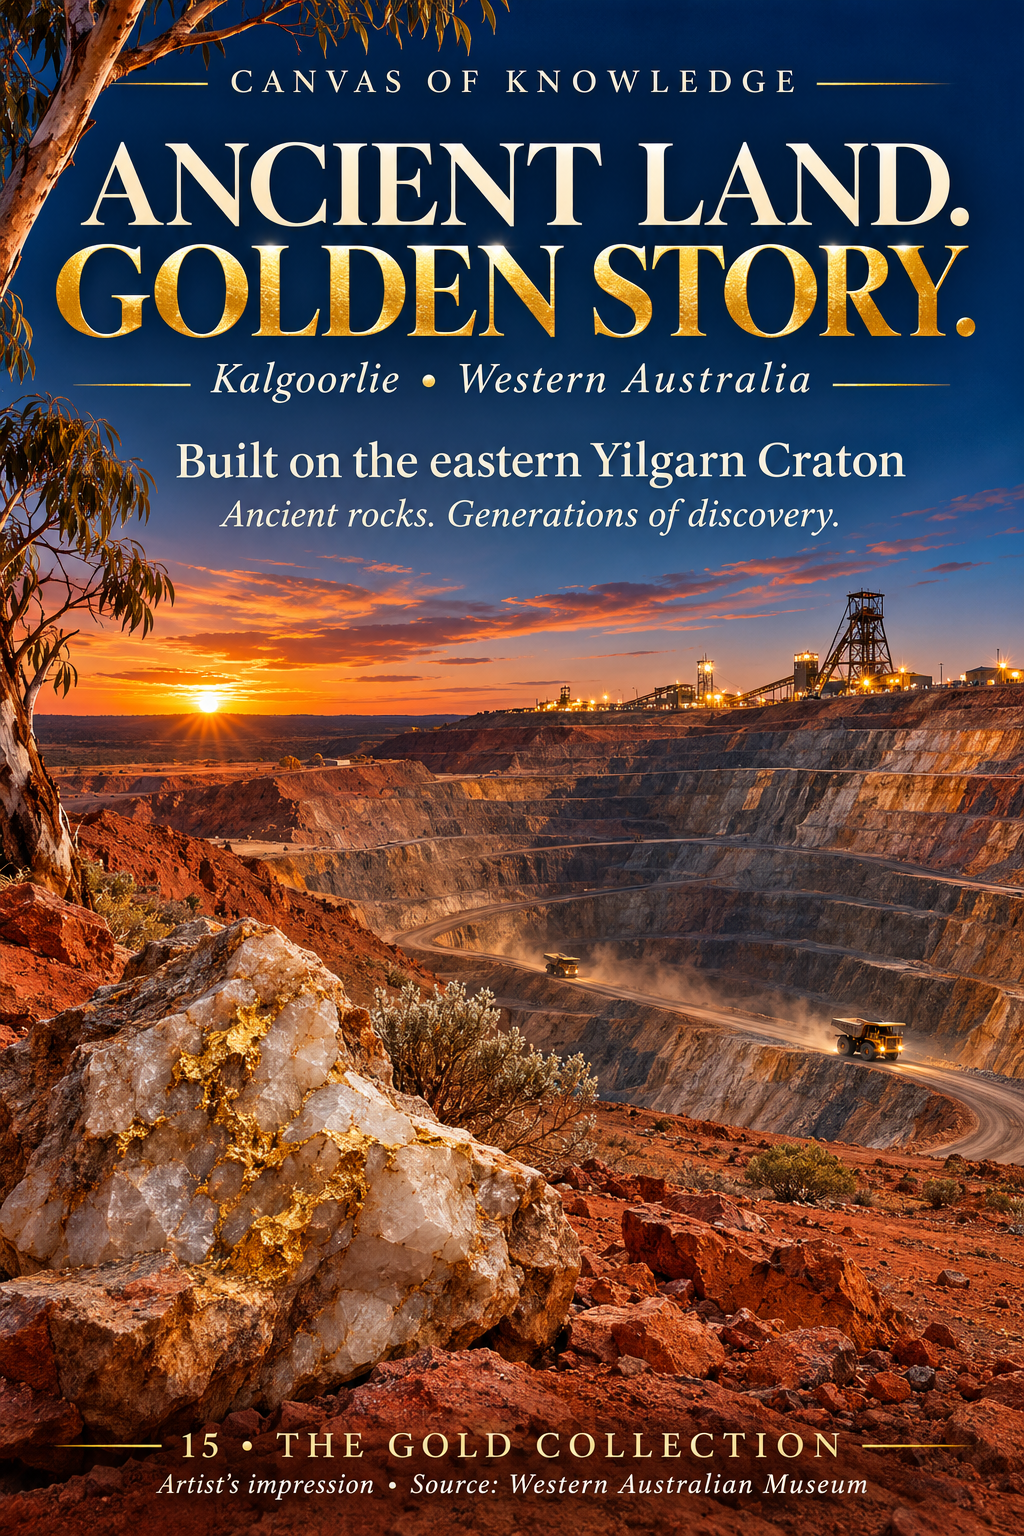
A dramatic Western Australian red-earth mining landscape with a terraced pit, quartz-rich foreground rocks and blue-to-gold evening skies.View full infographic
15 / 60

Kalgoorlie: an ancient land, a golden story

Western Australia’s deep geological roots.

Read the infographic & sources

Kalgoorlie is in the eastern Yilgarn Craton in Western Australia. A craton is an ancient, relatively stable part of continental crust. The region’s old rocks and long exploration history underpin its goldfields story.

An artist’s impression of the region, not a geospatial image of a particular pit. The scene does not compare mine sizes or gold quantities.

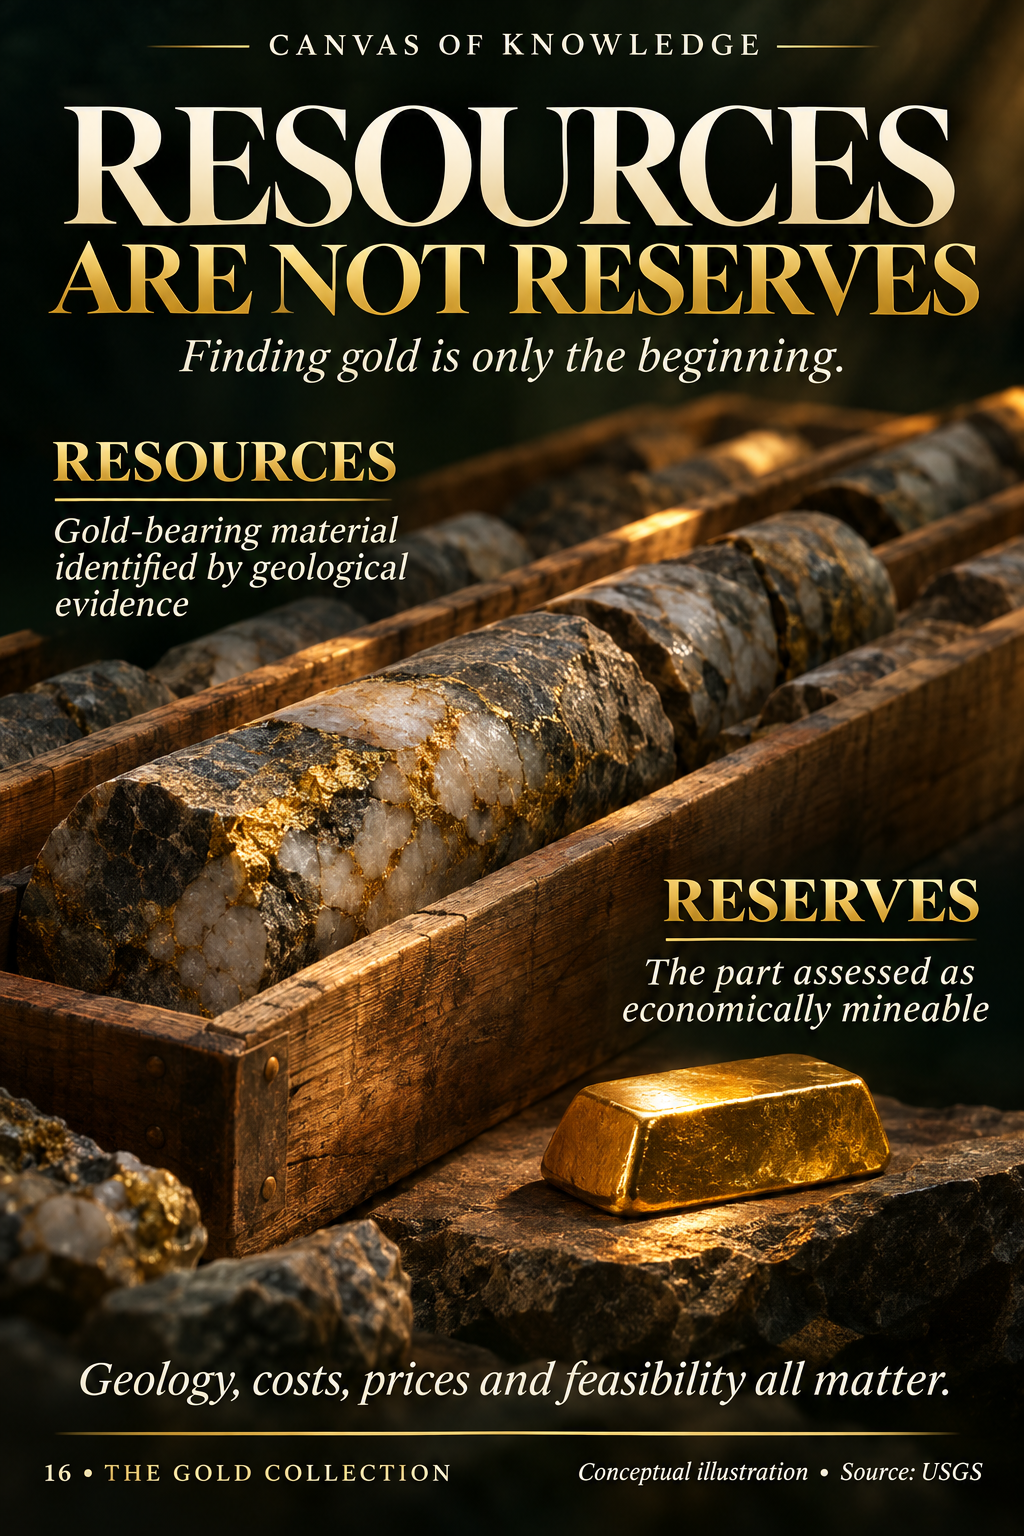
Drill cores in wooden trays and a gold ingot illustrate the distinction between geological evidence and economic mineability.View full infographic
16 / 60

Resources are not reserves

Finding gold is only the beginning.

Read the infographic & sources

Identified resources describe mineral material supported by geological evidence. Reserves are the part assessed as economically recoverable under the applicable conditions. Geological confidence, technical studies, costs, prices and other feasibility factors all matter.

Gold highlights in the drill cores are exaggerated and are not an assay result. A simplified distinction, not a complete reporting-code definition. Formal mineral-resource and reserve categories have specific requirements. Estimates can change as evidence and economics change; an undiscovered resource is not the same as an identified resource.

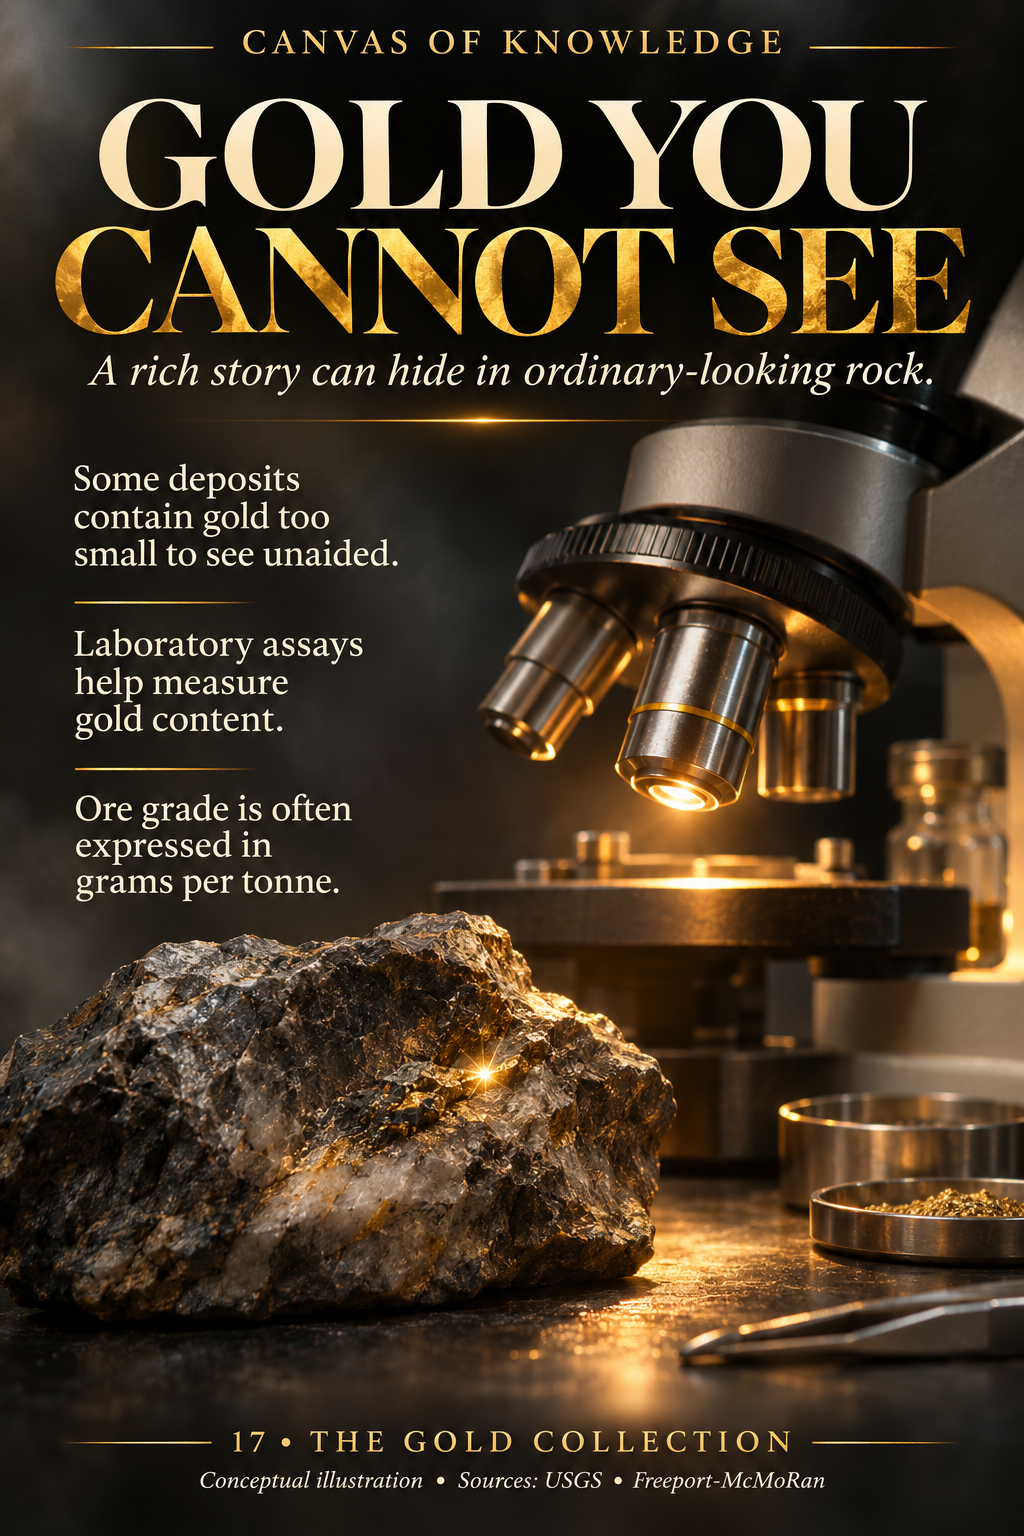
A dark rock sample and a laboratory microscope are lit with warm amber light to suggest gold too small to see unaided.View full infographic
17 / 60

Gold you cannot see

Ordinary-looking rock can hold an extraordinary story.

Read the infographic & sources

Some ores contain gold that cannot be seen with the naked eye. Assays help determine metal content. Gold ore grade is often reported in grams per metric tonne, written g/t. For example, 1 g/t means one gram of contained gold per tonne of ore; it does not mean all that gold will be recovered.

The rock and metallic glint are conceptual. This is not a microscope image, an assay result or a scale comparison. The numerical example explains a unit and is not a typical grade or profitability threshold.

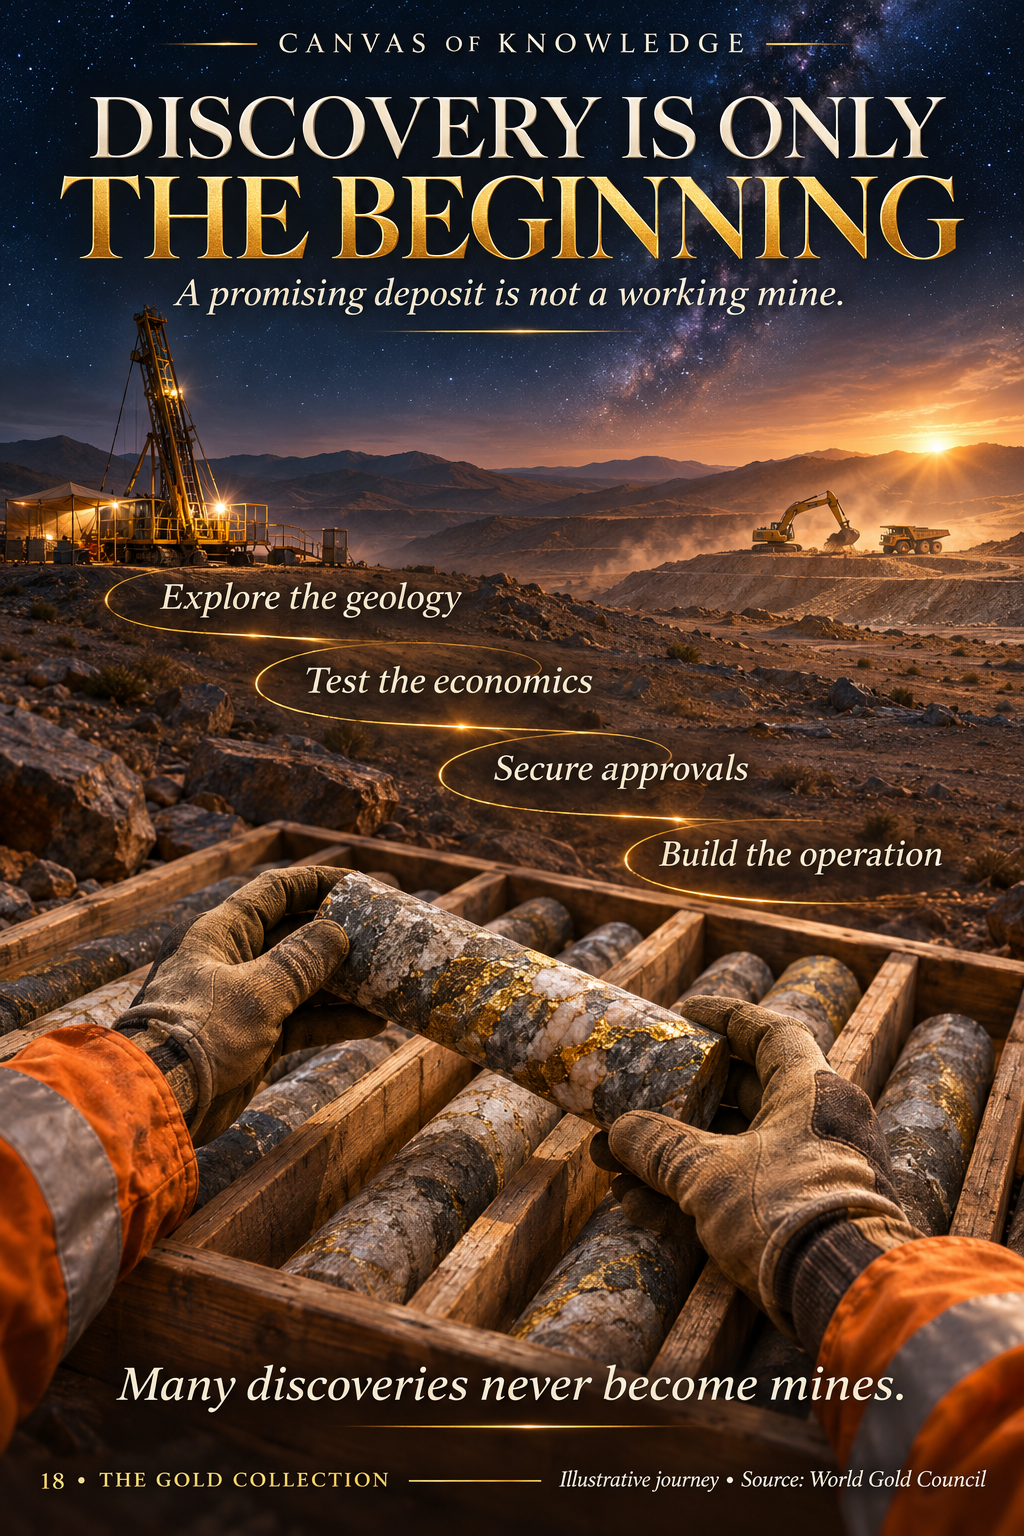
Exploration drilling, hands inspecting drill core and distant mine construction share one atmospheric landscape.View full infographic
18 / 60

Discovery is only the beginning

A promising deposit is not a working mine.

Read the infographic & sources

Exploration builds knowledge of the geology. Technical and economic studies assess whether a mine could work. Approvals and construction are further steps before production. Many discoveries never reach that stage.

Gold highlights in the drill cores are exaggerated and are not an assay result. The illustration simplifies an iterative process. Studies, consultation and approvals can overlap, be repeated, or stop a project. It is not a fixed timeline or a guarantee of development.

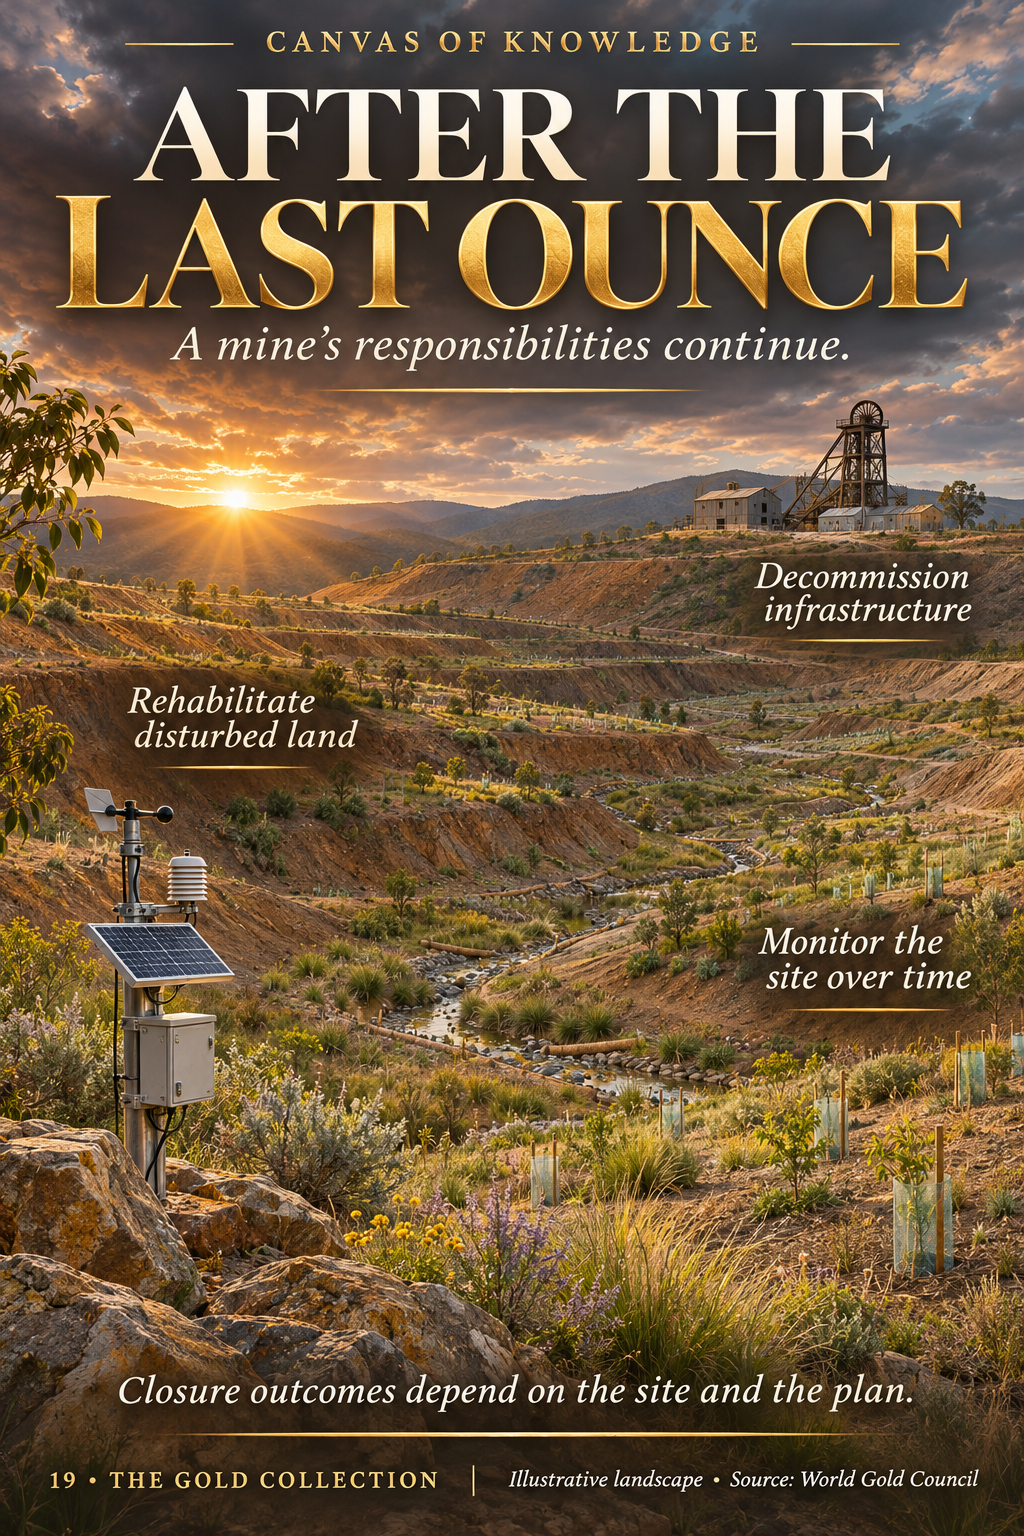
A conceptual former mine landscape undergoing rehabilitation, with recontoured terraces, native planting and environmental monitoring equipment.View full infographic
19 / 60

After the last ounce

Responsibilities continue after production ends.

Read the infographic & sources

Mine closure can involve dismantling infrastructure, rehabilitating disturbed land and monitoring the site over time. Long-term responsibilities remain after production ends. Outcomes depend on the particular site, the closure plan and its implementation.

Illustrative rehabilitation in progress, not a before-and-after claim about a real mine. Reclamation does not guarantee a return to the original landscape or the removal of every environmental impact.

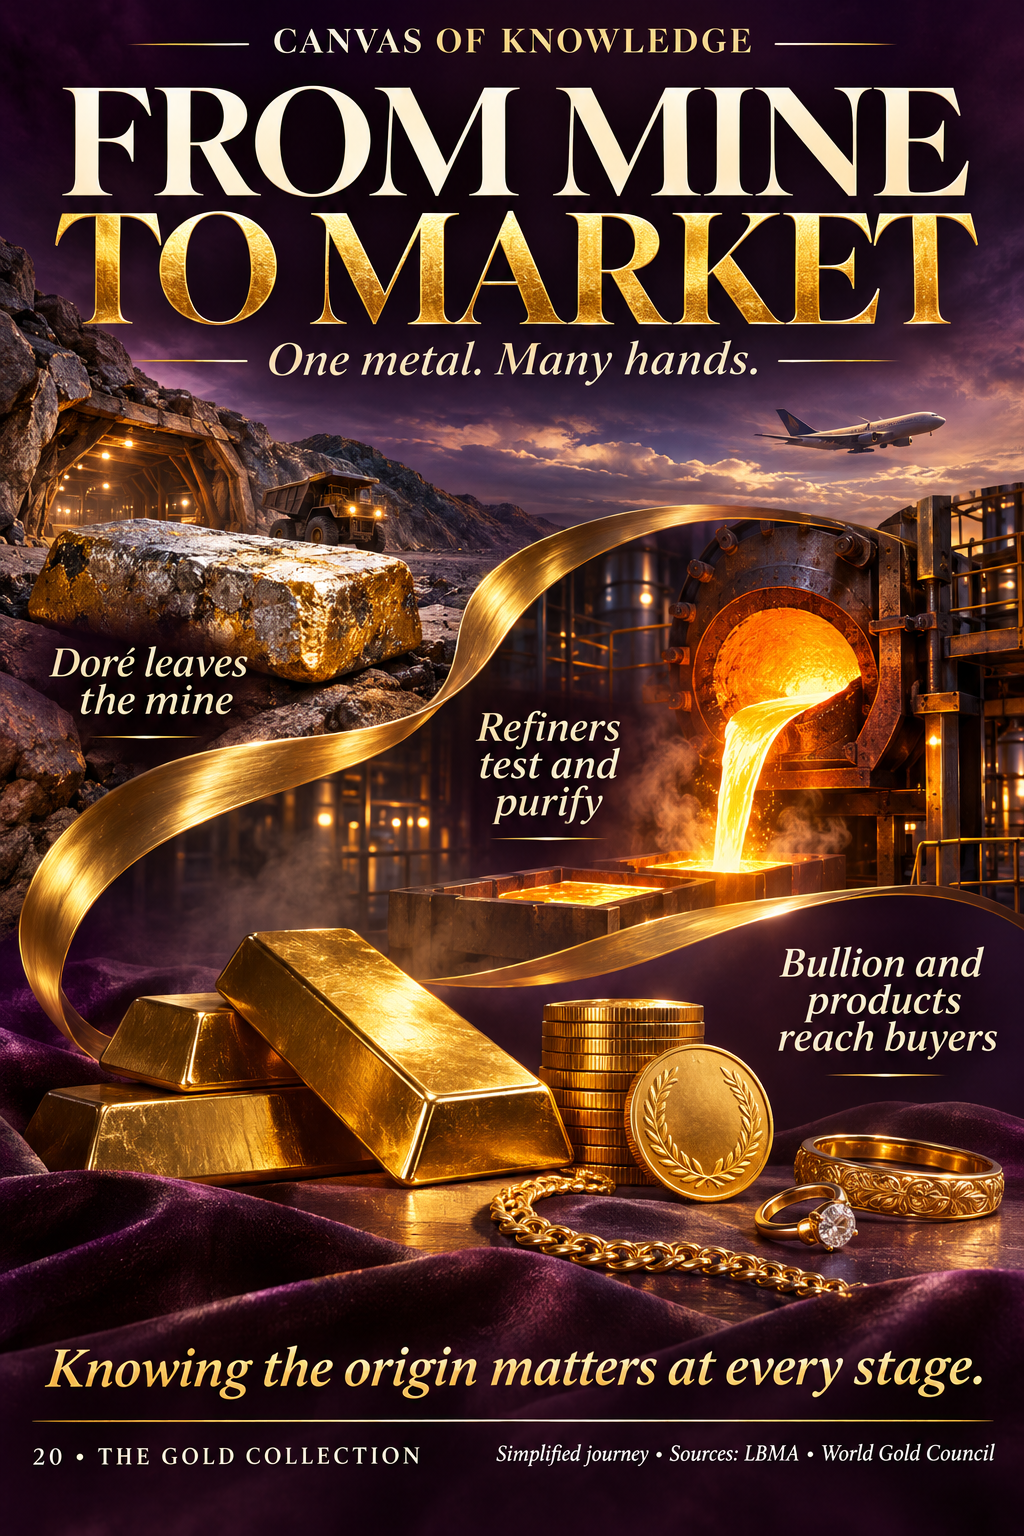
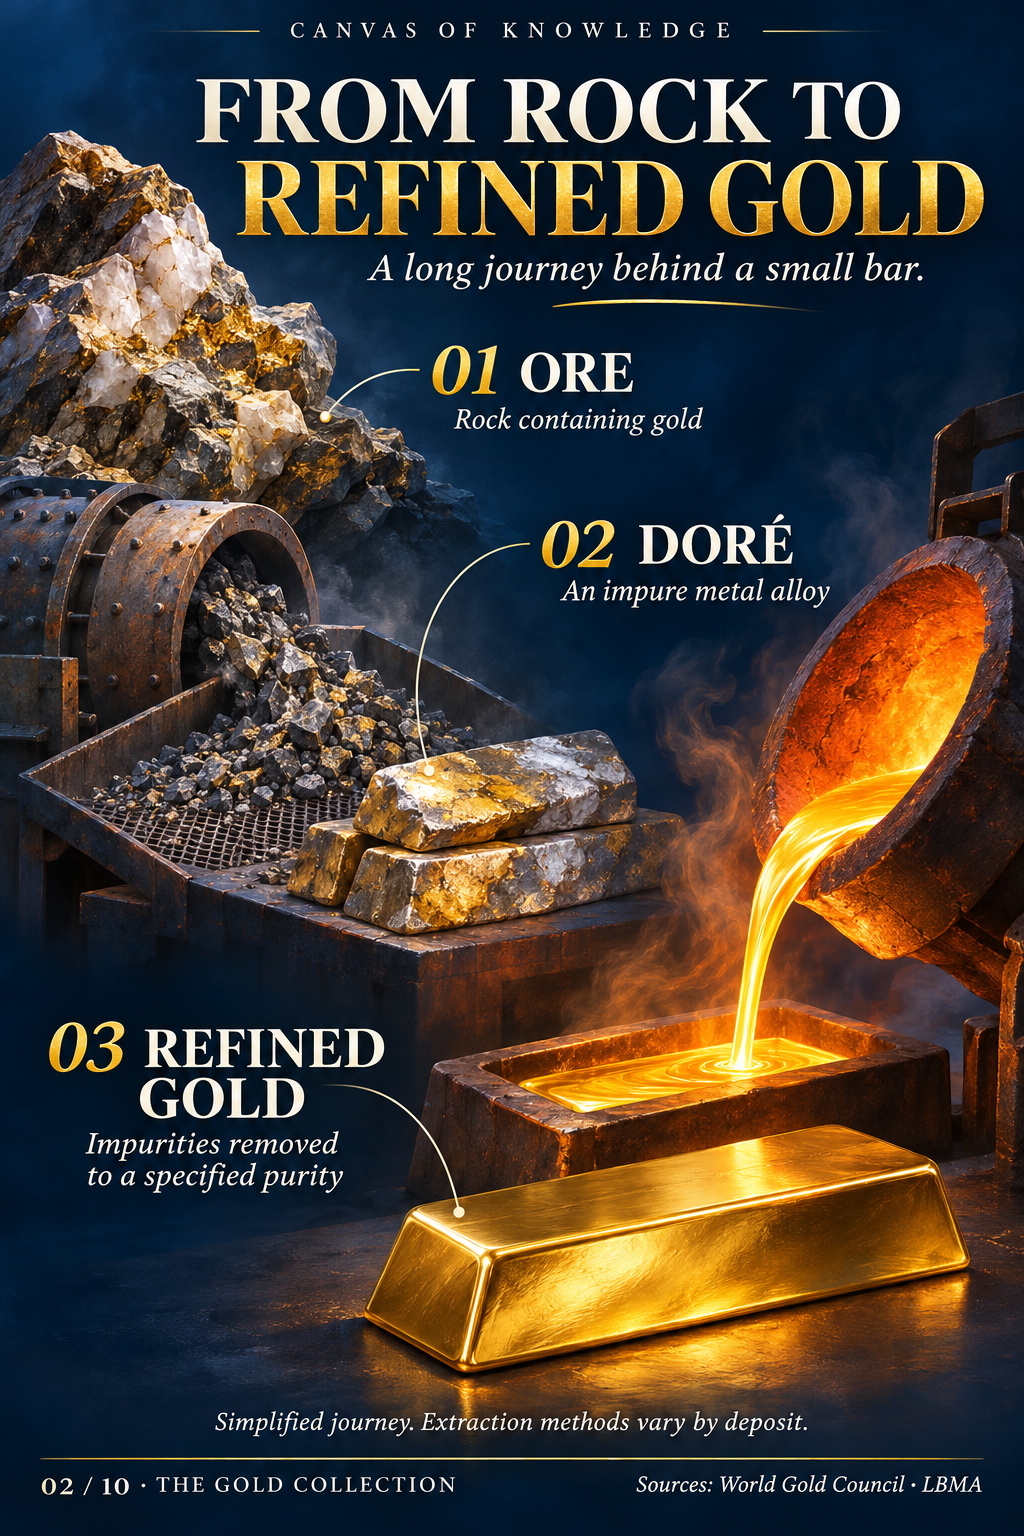
A sculptural gold ribbon links a doré bar, refinery, bullion, coin and jewellery, with transport suggested in the background.View full infographic
20 / 60

From mine to market

One metal. Many hands.

Read the infographic & sources

Gold-bearing material can leave a mine as doré, an impure alloy. Refiners assay and purify it before it becomes bullion or other products. Responsible sourcing examines provenance and risks along the chain.

This is one simplified route. Some mines ship concentrates, and recycled gold follows other routes. A refining step or a beautiful bar alone does not establish responsible provenance.

CHAPTER 03 / 21—30

Gold, money & markets

Ten illustrated articles, from the first coins to modern gold markets.

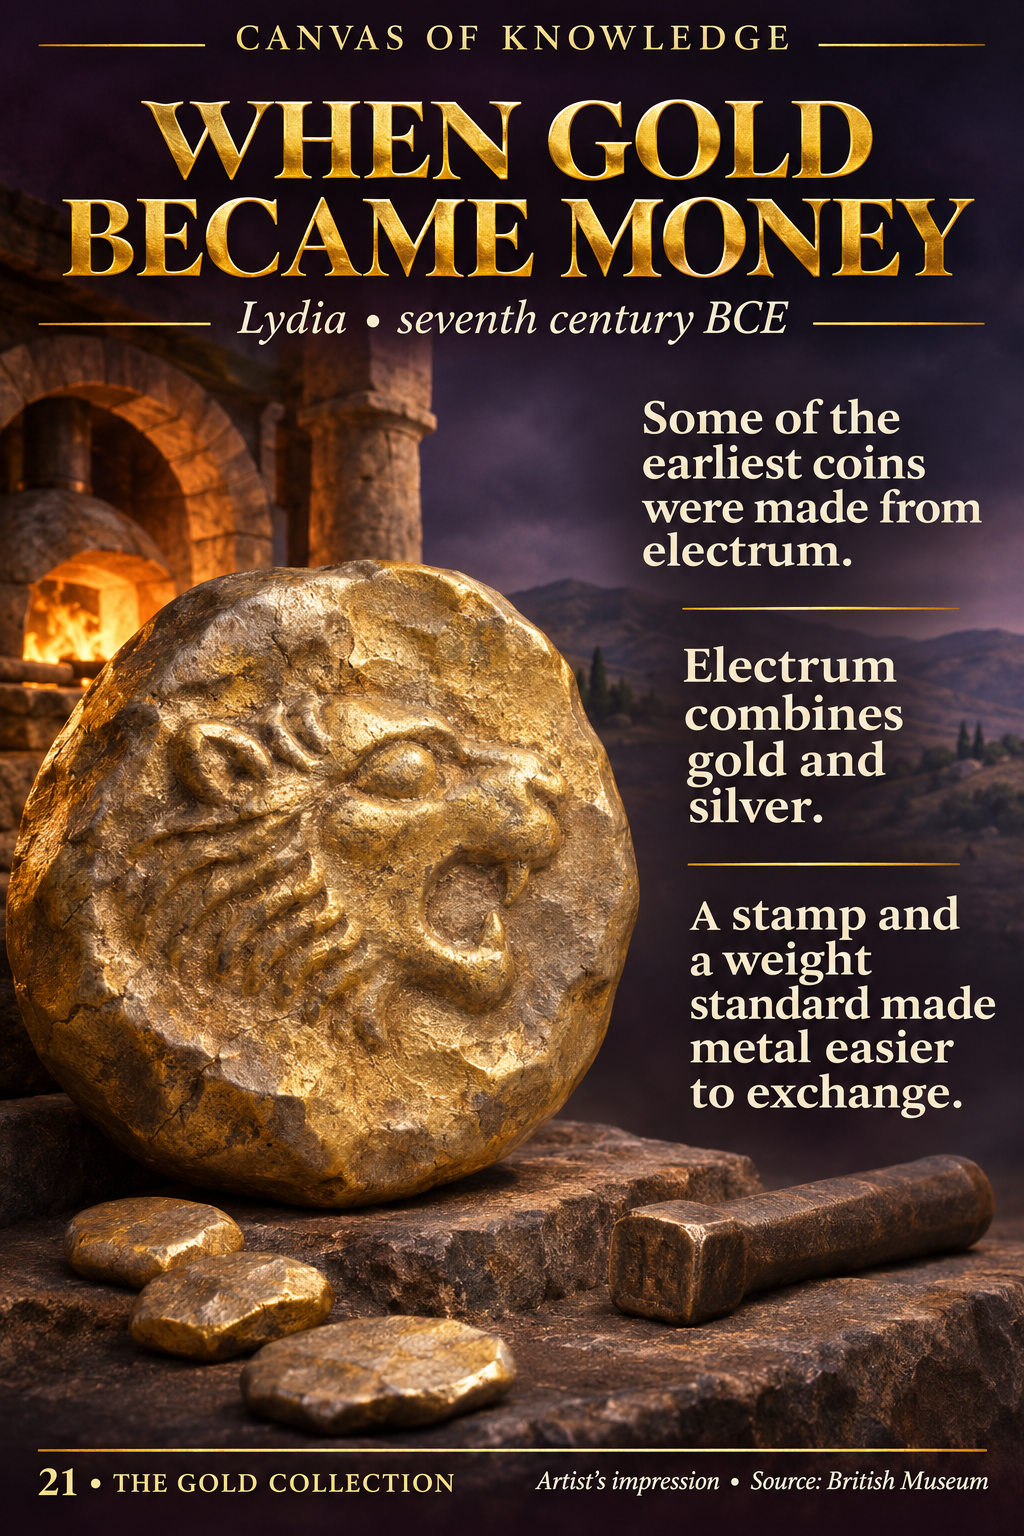
An imagined early electrum coin with a lion relief beside smaller coins and minting tools.View full infographic
21 / 60

When gold became money

Lydia’s early electrum coins reveal how weight, authority and trust turned precious metal into a recognisable means of exchange.

Read the infographic & sources

Lydia · seventh century BCE. Some of the earliest coins were made from electrum. Electrum combines gold and silver. A stamp and a weight standard made metal easier to exchange.

Artist’s impression, not a photograph of an identified ancient coin. Early coinage dates remain a subject of research.

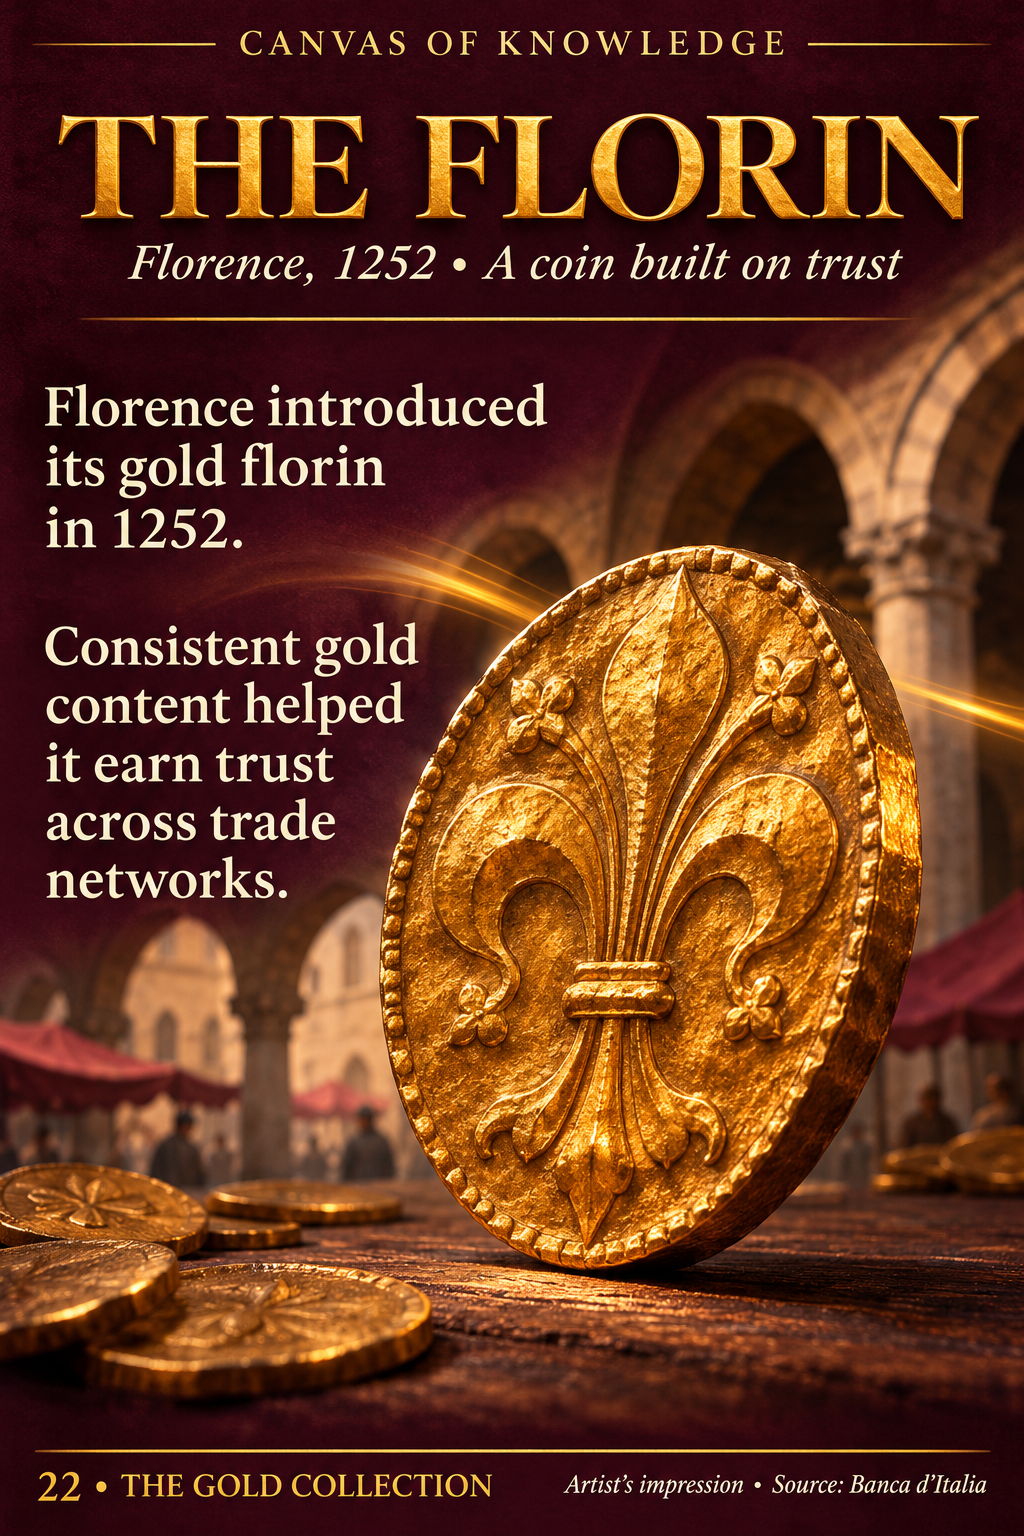
An artist’s interpretation of a gold florin with a lily motif against a medieval Florentine trading scene.View full infographic
22 / 60

The florin: a coin built on trust

Introduced in Florence in 1252, the gold florin shows why reliable money depends on more than a valuable material.

Read the infographic & sources

The florin. Florence, 1252 · A coin built on trust. Florence introduced its gold florin in 1252. Consistent gold content helped it earn trust across trade networks.

Illustrative coin and setting. The artwork is not an authenticated specimen or a reconstruction of a particular transaction.

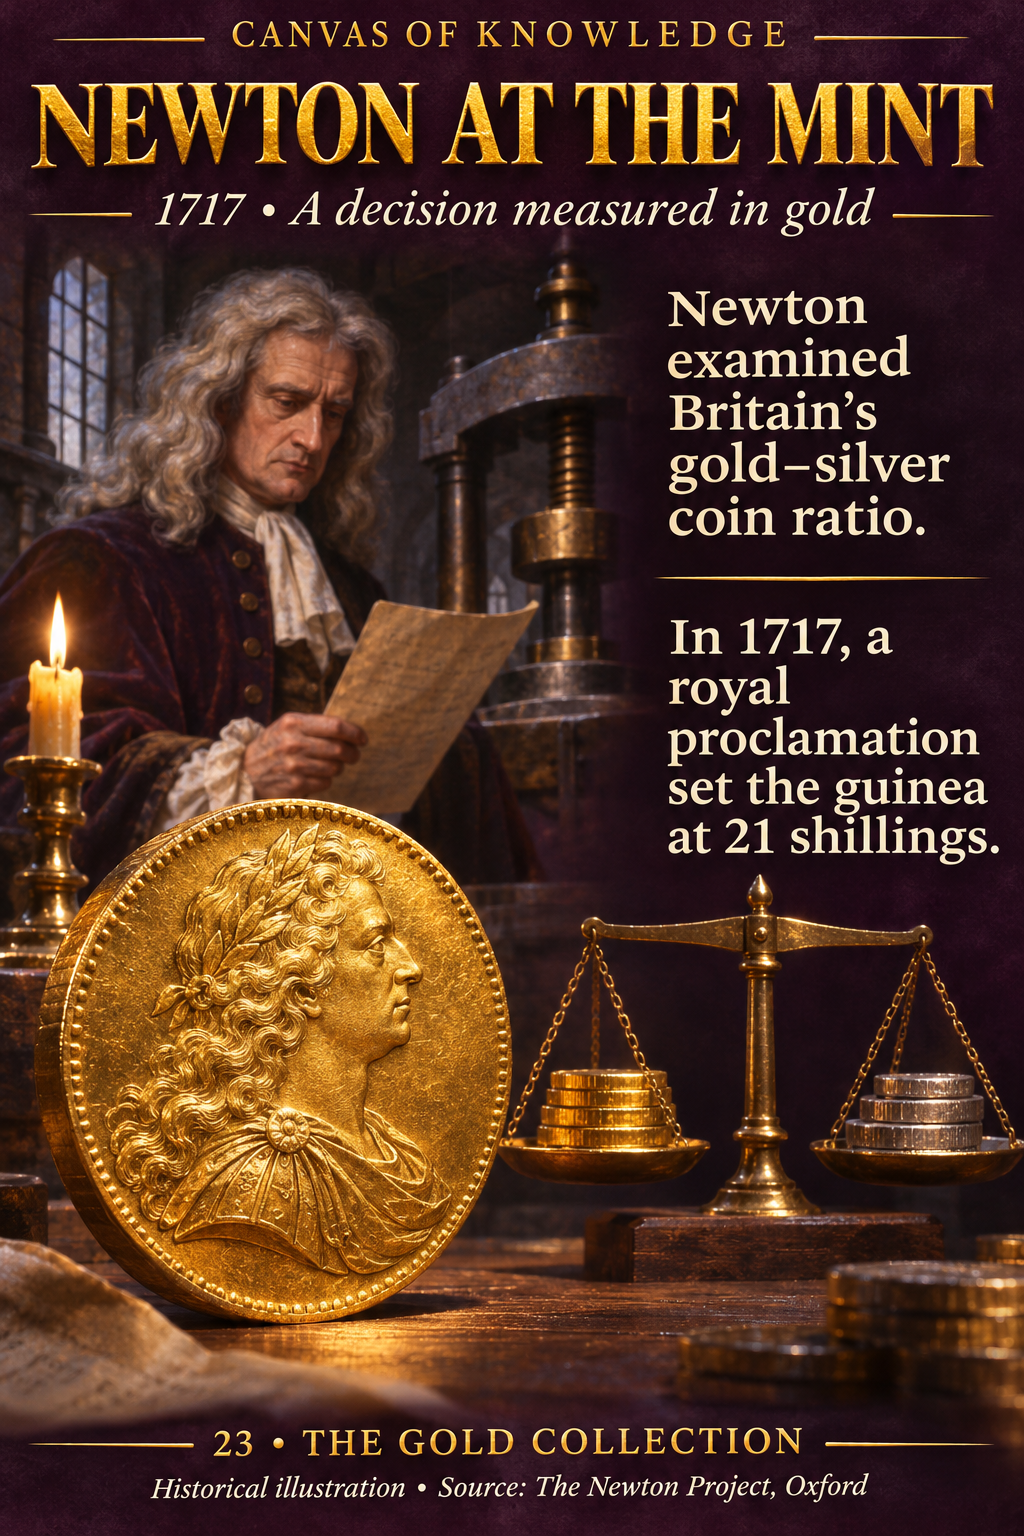
A historical illustration of Isaac Newton in a mint workshop, beside a gold coin and a balance holding gold and silver.View full infographic
23 / 60

Newton at the Mint

In 1717, a question about gold and silver became a question about incentives—and the guinea’s official value.

Read the infographic & sources

Newton at the Mint. 1717 · A decision measured in gold. Newton examined Britain’s gold–silver coin ratio. In 1717, a royal proclamation set the guinea at 21 shillings.

Historical illustration, not a documentary portrait of the 1717 report. The coin and balance are illustrative.

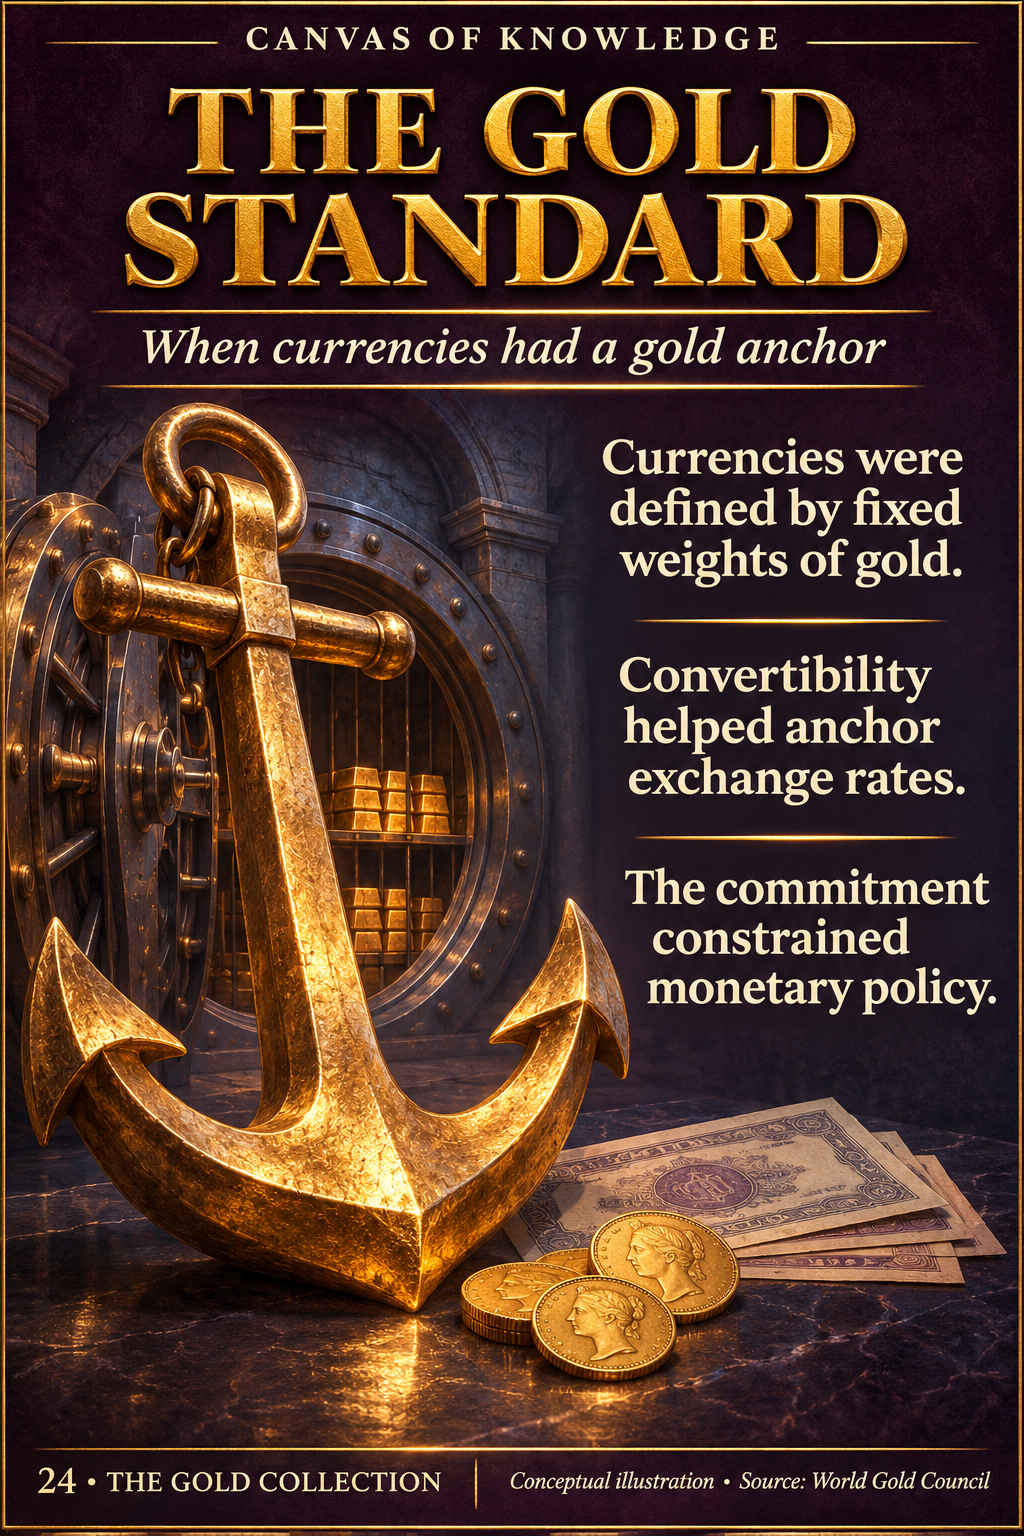
A monumental gold anchor beside a bank vault, coins and decorative banknotes symbolises currency convertibility.View full infographic
24 / 60

The gold standard: a monetary anchor

Fixed gold weights connected currencies to one another, but defending convertibility imposed difficult choices.

Read the infographic & sources

The gold standard. When currencies had a gold anchor. Currencies were defined by fixed weights of gold. Convertibility helped anchor exchange rates. The commitment constrained monetary policy.

Conceptual illustration. The anchor and banknotes do not show actual reserve ratios, currency values or bullion quantities.

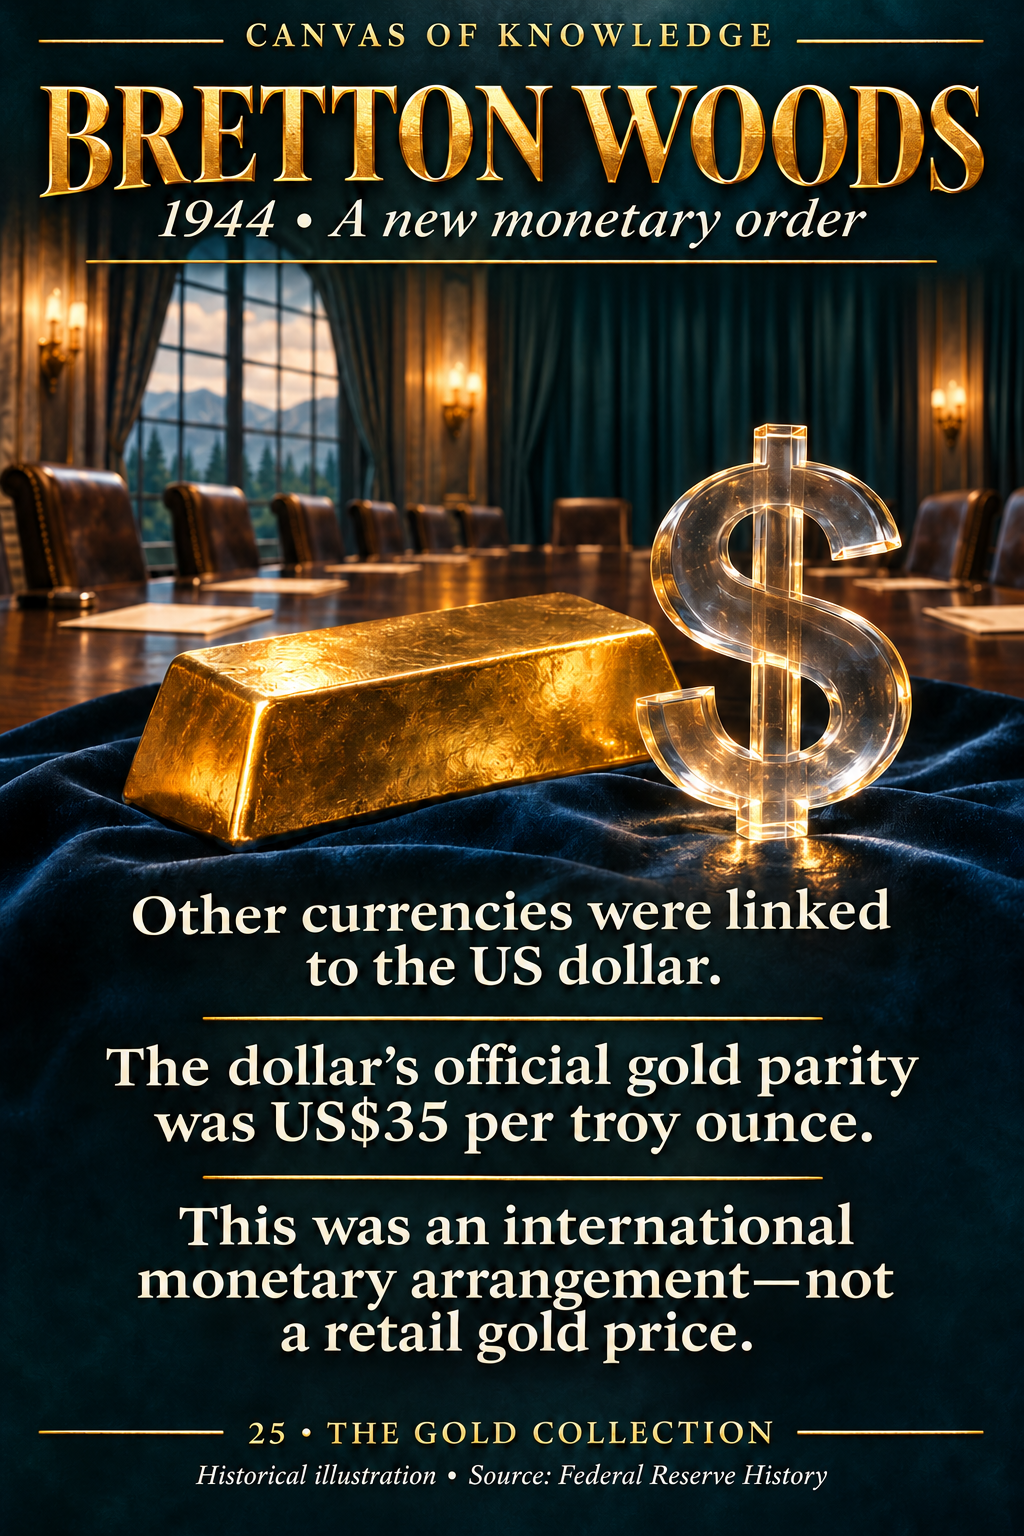
A conceptual gold bar and translucent dollar symbol in an imagined 1940s international conference room.View full infographic
25 / 60

Bretton Woods: gold behind the dollar

The 1944 agreement placed the dollar at the centre of a new international monetary framework, with gold behind its official parity.

Read the infographic & sources

Bretton Woods. 1944 · A new monetary order. Other currencies were linked to the US dollar. The dollar’s official gold parity was US$35 per troy ounce. This was an international monetary arrangement—not a retail gold price.

Historical conceptual illustration, not a reconstruction of a particular conference session. The gold bar does not represent an actual conference object.

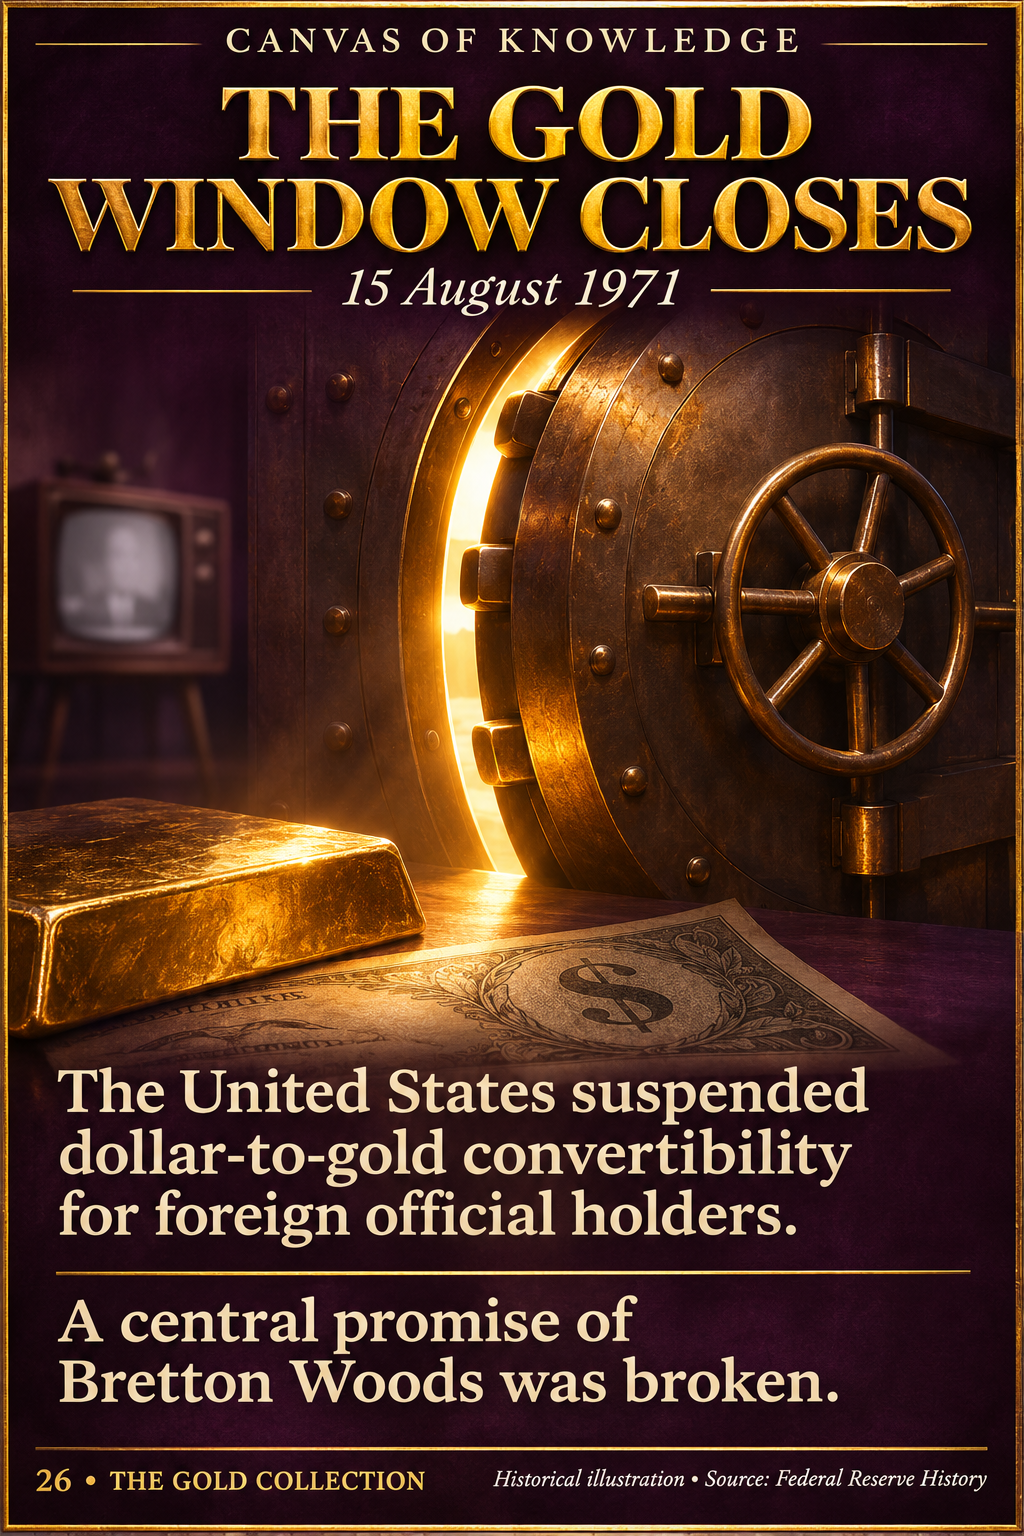
A closing vault door with a narrow band of golden light, a gold bar and a blurred period television.View full infographic
26 / 60

The gold window closes

What changed on 15 August 1971—and why the transition to floating exchange rates was a longer process.

Read the infographic & sources

The gold window closes. 15 August 1971. The United States suspended dollar-to-gold convertibility for foreign official holders. A central promise of Bretton Woods was broken.

Conceptual historical scene. The closing vault is a metaphor; it does not portray an actual Treasury operation.

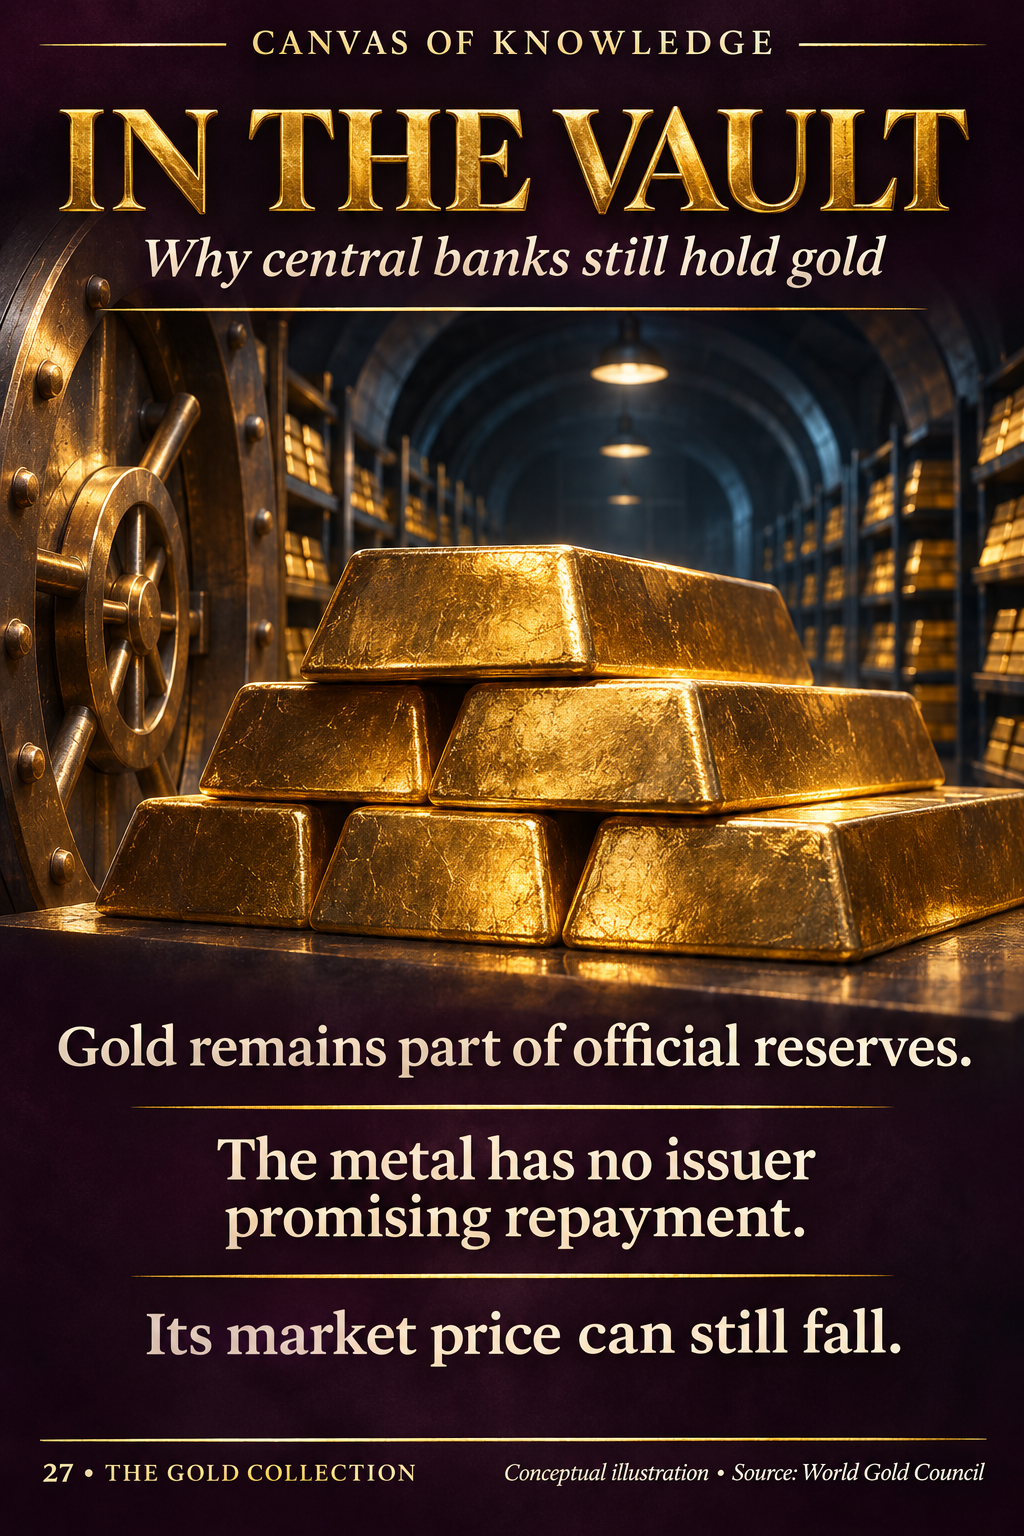
A conceptual central-bank vault with gold bars in the foreground and shelves receding into darkness.View full infographic
27 / 60

In the vault: why central banks hold gold

Gold remains an official reserve asset, but the absence of an issuer is different from the absence of risk.

Read the infographic & sources

In the vault. Why central banks still hold gold. Gold remains part of official reserves. The metal has no issuer promising repayment. Its market price can still fall.

Imagined vault. Bar counts and apparent quantities do not describe the holdings of any real central bank.

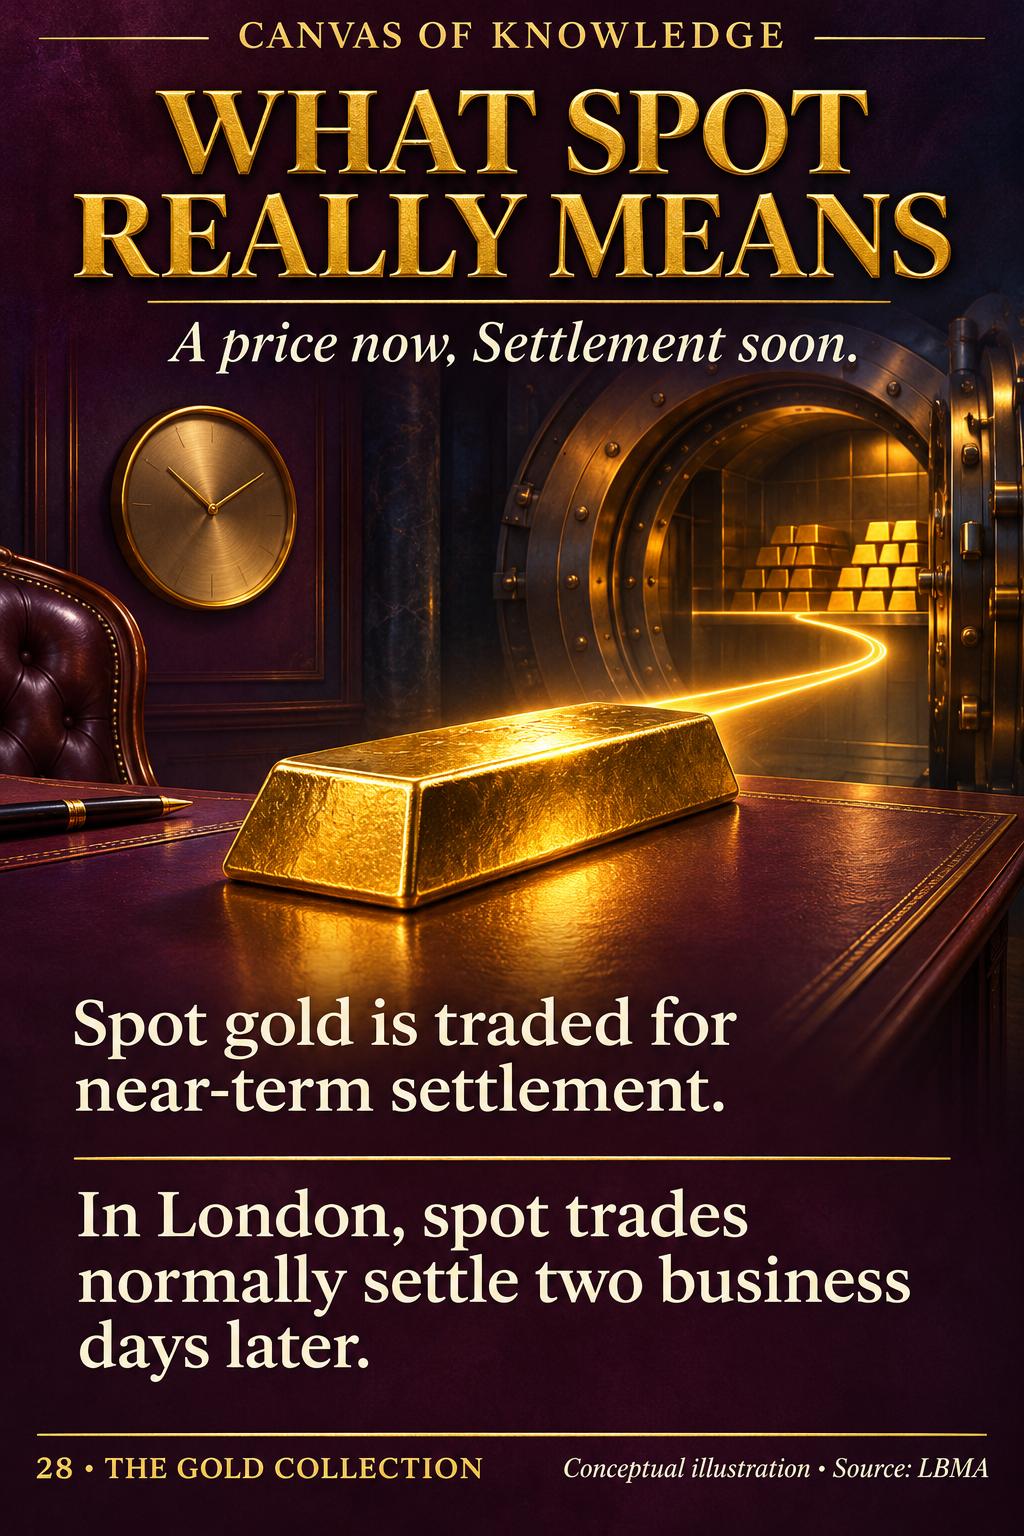
A gold bar on a dealing desk connected by a ribbon of light to a vault, with a clock suggesting settlement time.View full infographic
28 / 60

What spot really means

A price can be agreed now even when the exchange of money and metal settles later.

Read the infographic & sources

What spot really means. A price now. Settlement soon. Spot gold is traded for near-term settlement. In London, spot trades normally settle two business days later.

Conceptual illustration. The clock and light path do not show an actual payment system or a guaranteed settlement schedule.

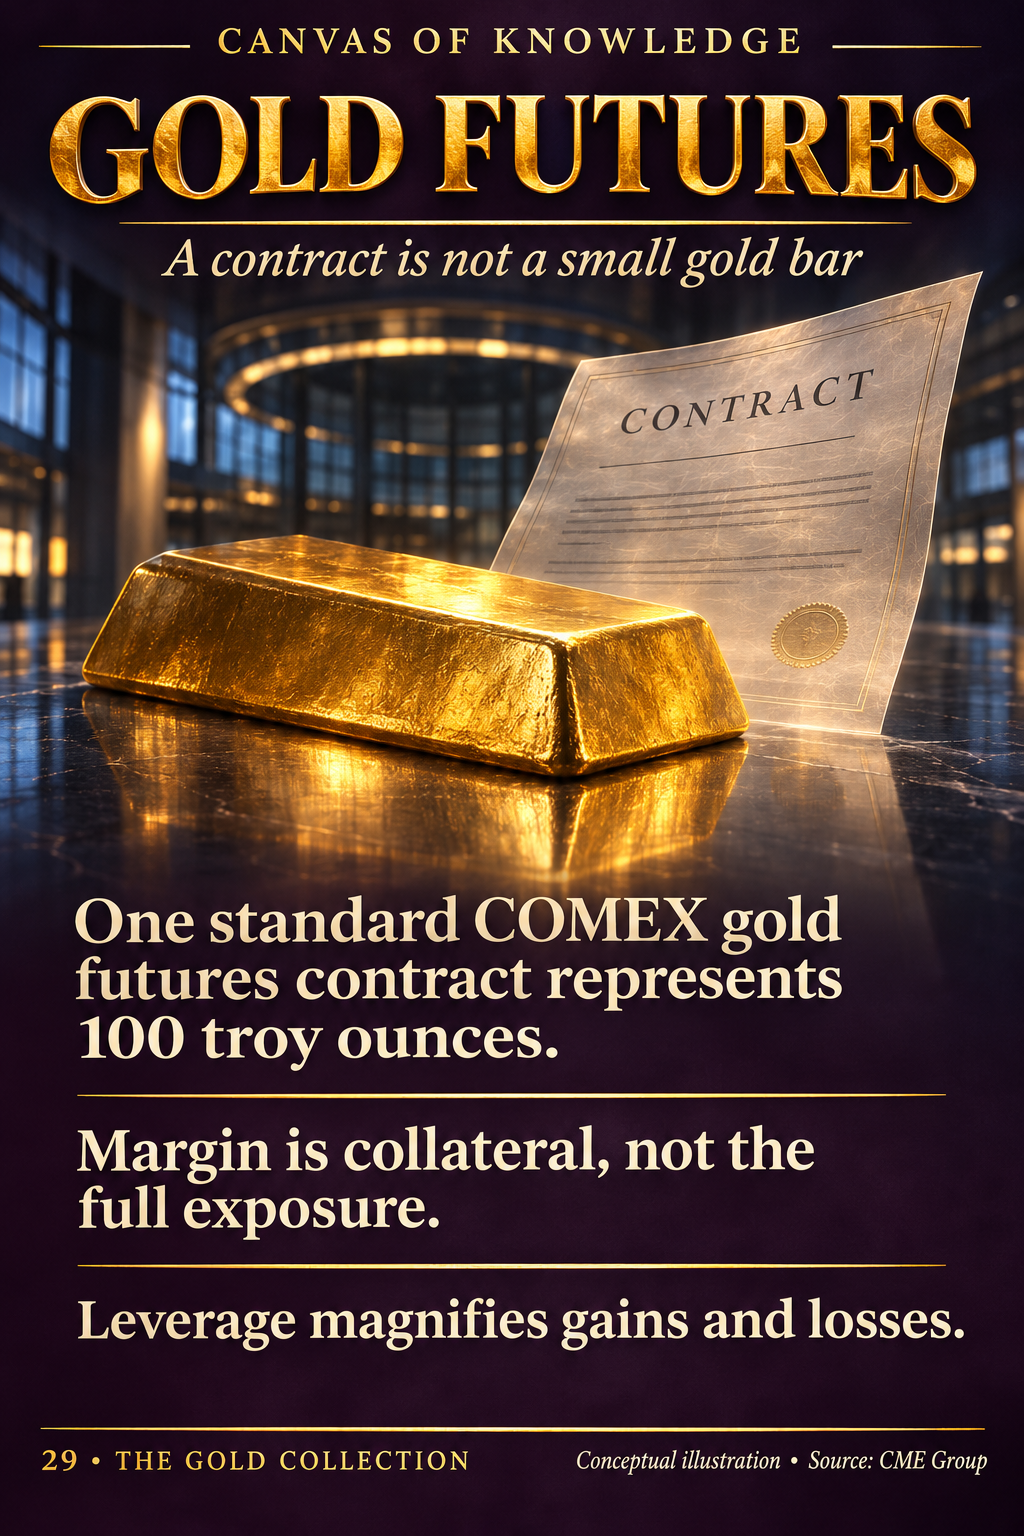
A luminous gold bar beside a translucent contract document in a conceptual exchange setting.View full infographic
29 / 60

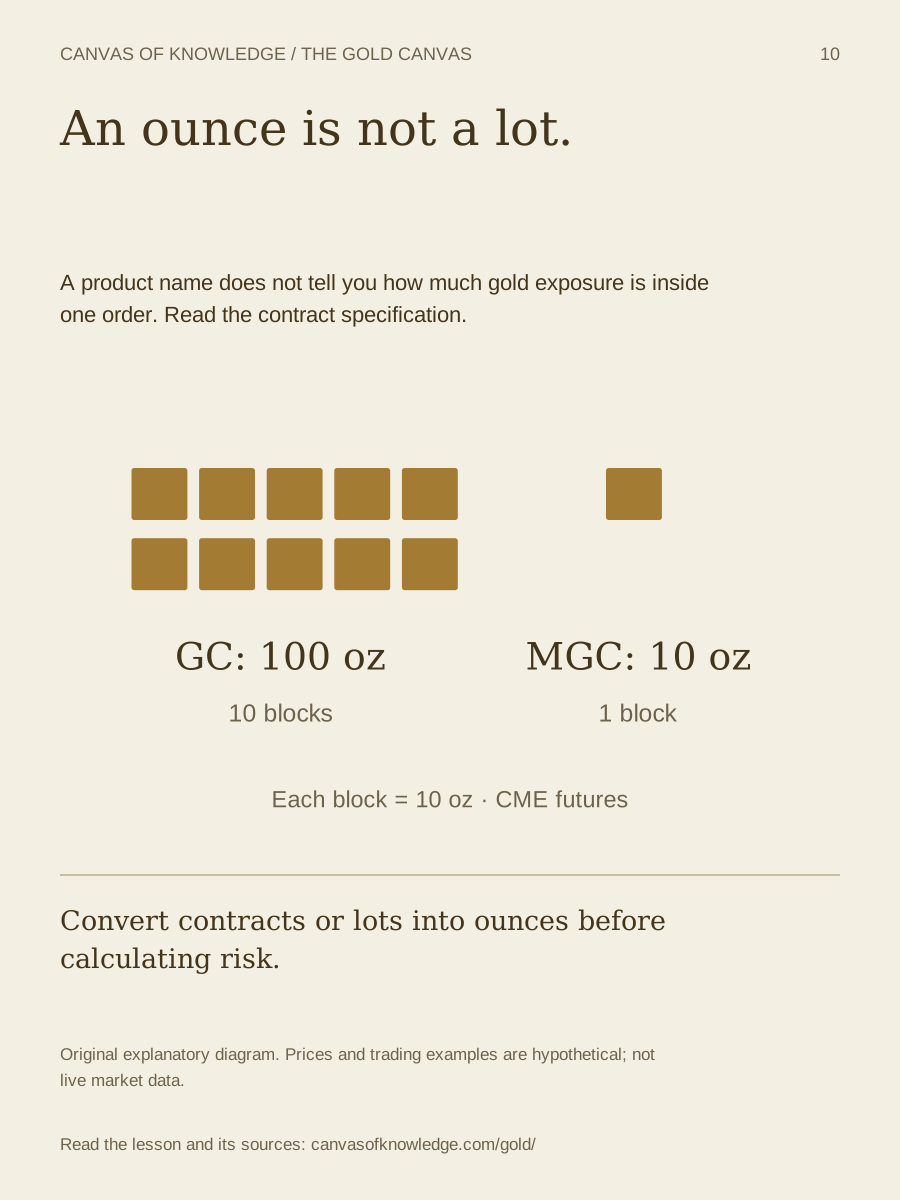
Gold futures: the contract and the exposure

The standard COMEX contract represents 100 troy ounces. A smaller margin deposit does not make that exposure smaller.

Read the infographic & sources

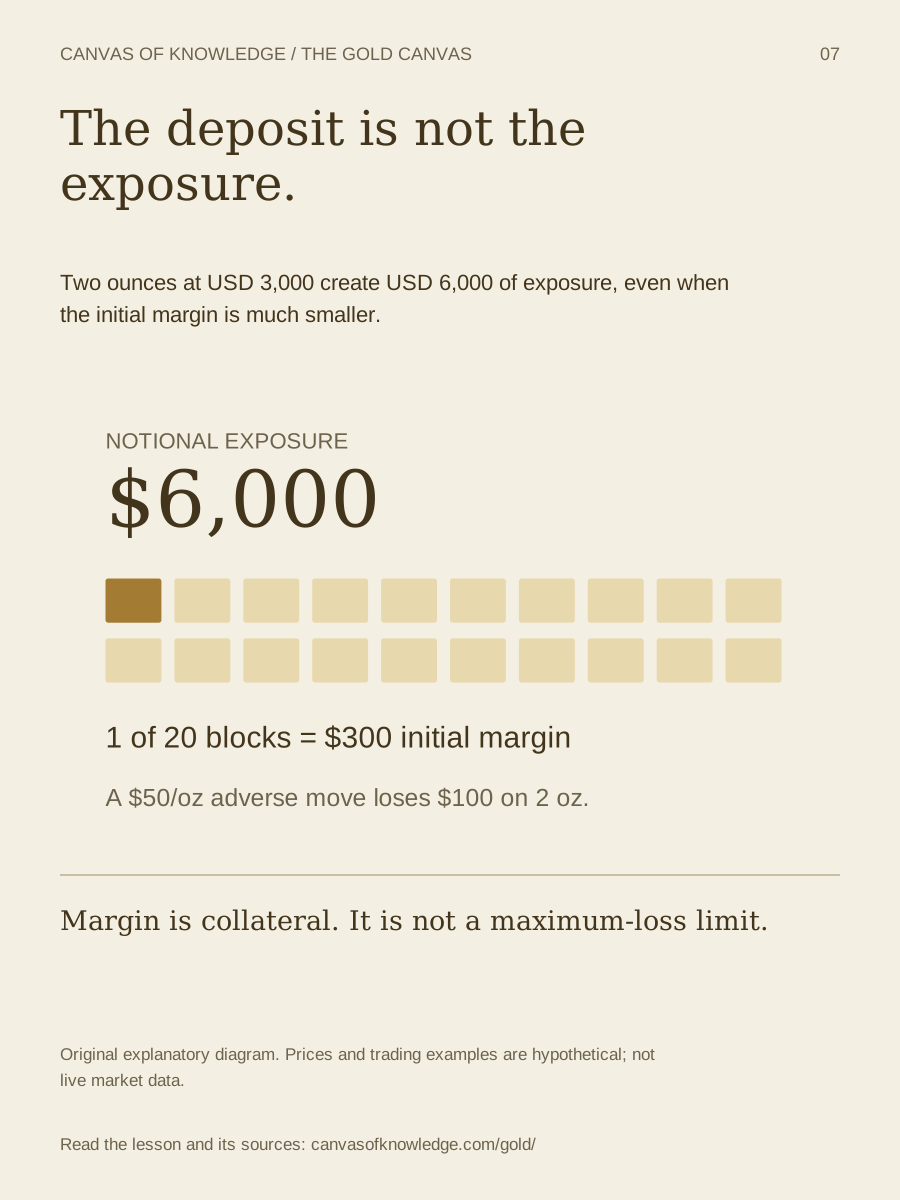
Gold futures. A contract is not a small gold bar. One standard COMEX gold futures contract represents 100 troy ounces. Margin is collateral, not the full exposure. Leverage magnifies gains and losses.

Conceptual illustration. No displayed bar weight, live gold price or current margin requirement is implied.

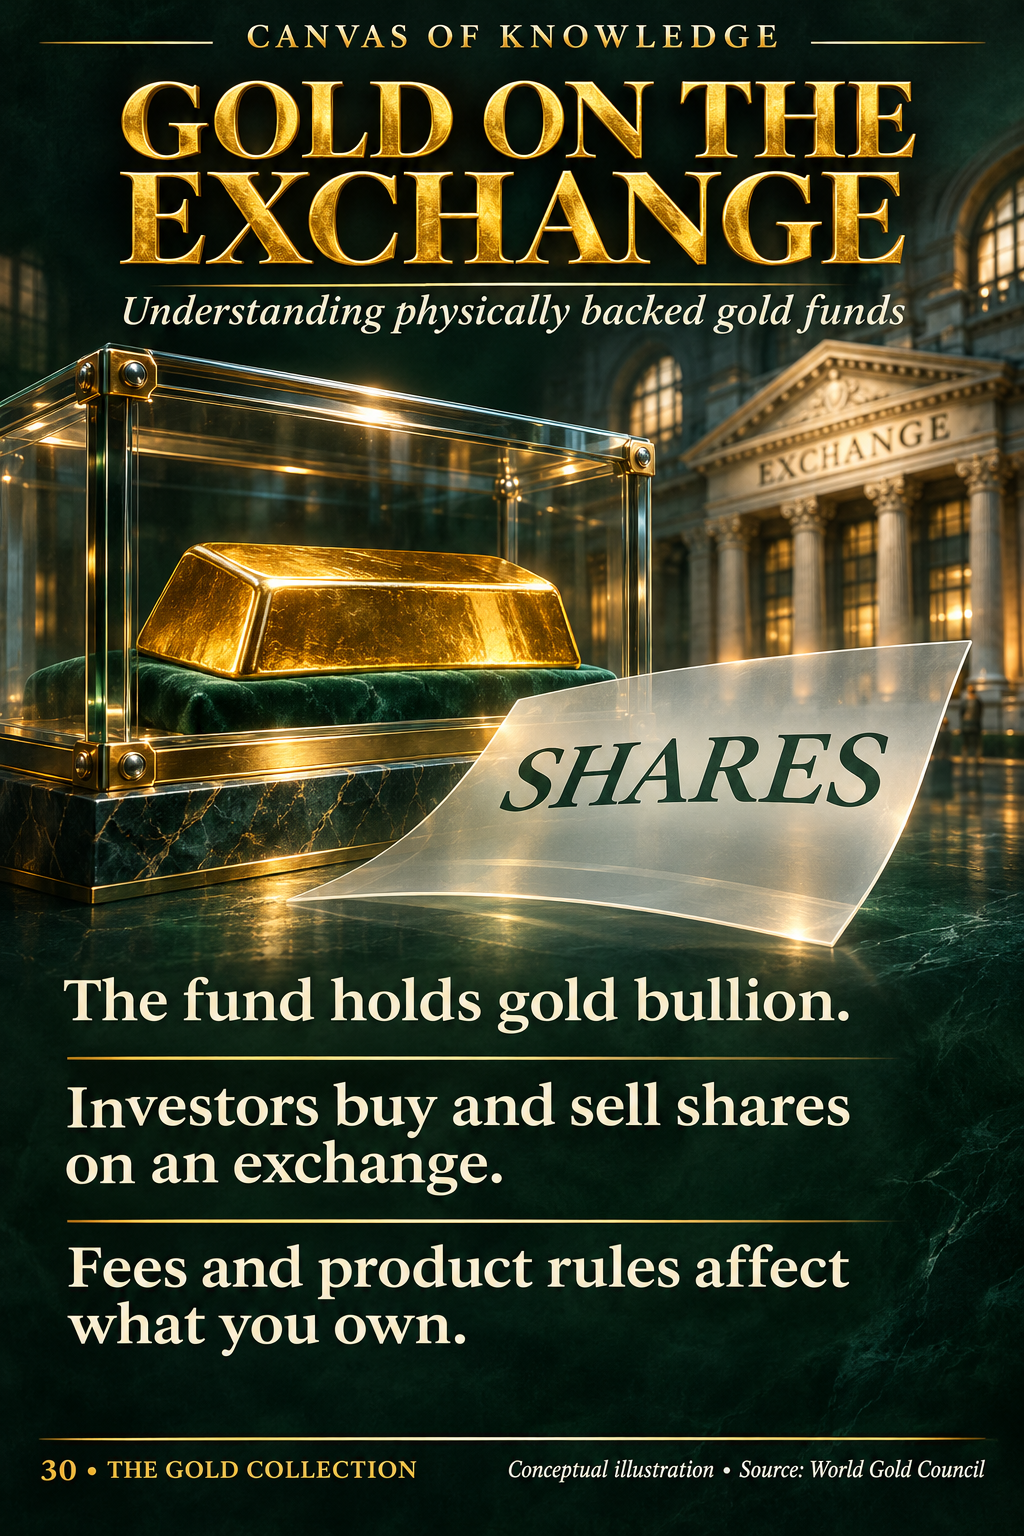
A gold bar in a glass enclosure with a translucent sheet marked shares in an imagined exchange hall.View full infographic
30 / 60

Gold on the exchange

Physically backed gold vehicles combine bullion holdings with tradable securities. The legal structure determines what an investor actually owns.

Read the infographic & sources

Gold on the exchange. Understanding physically backed gold funds. The fund holds gold bullion. Investors buy and sell shares on an exchange. Fees and product rules affect what you own.

Conceptual illustration, not a particular fund or endorsement. Product structures, custody and redemption rights differ.

CHAPTER 04 / 31—40

Inside the gold market

Ten illustrated articles on bullion, custody, benchmarks and the contracts behind the trade.

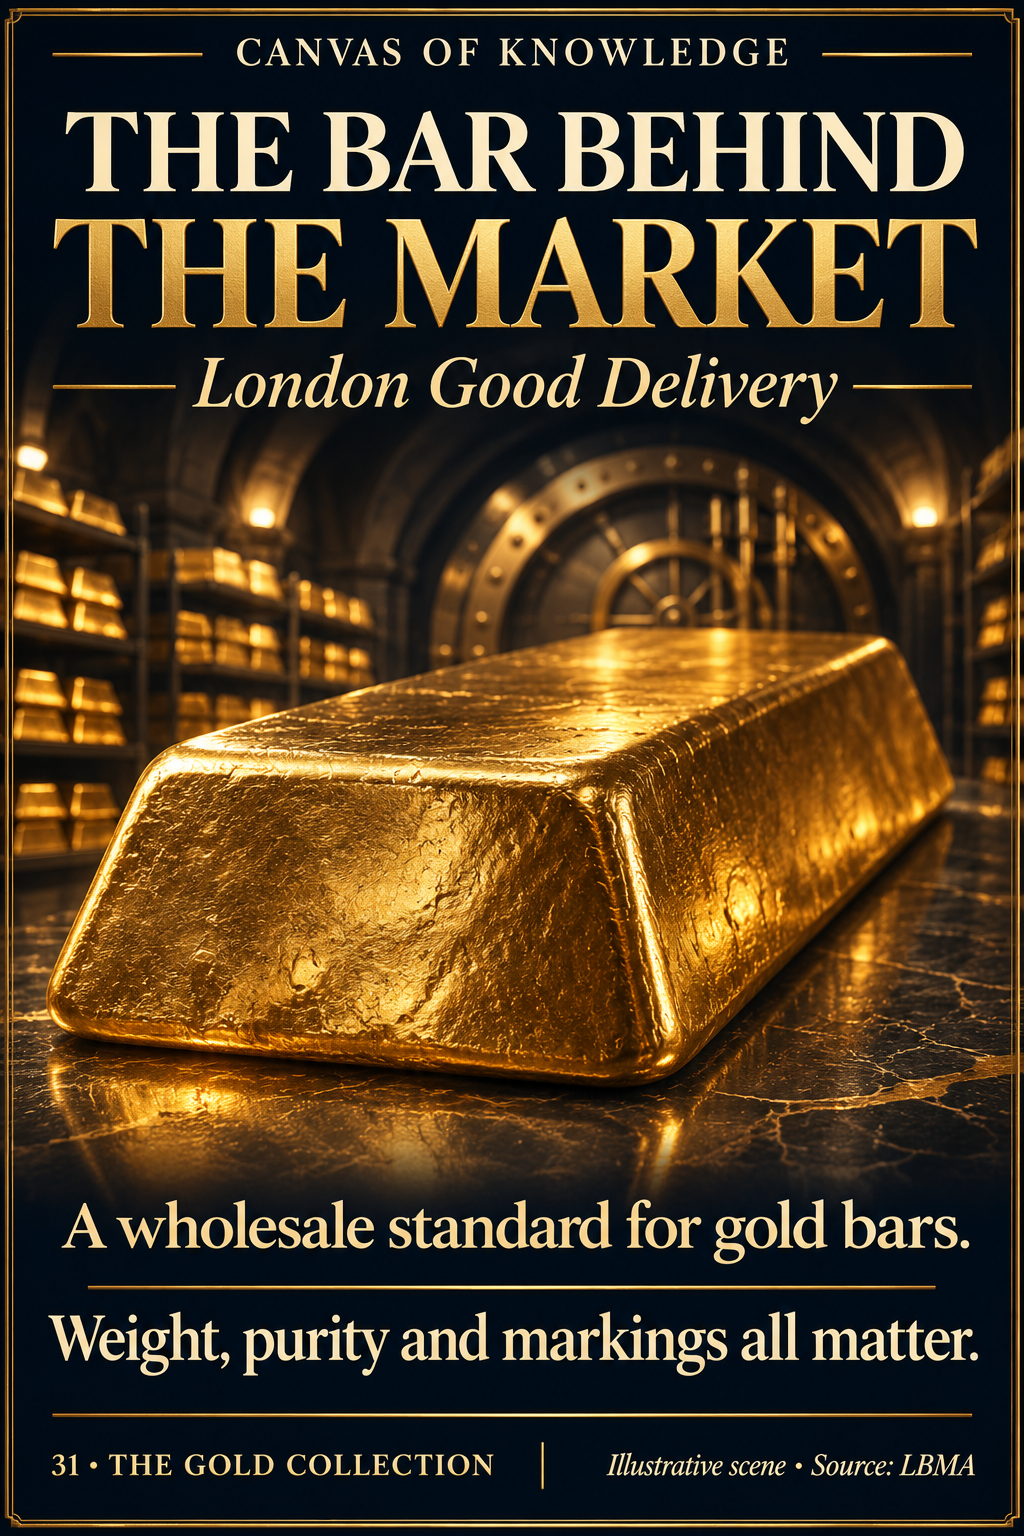
A large cast gold bar rests on a dark vault shelf, its textured surface catching a narrow beam of warm light.View full infographic
31 / 60

The bar behind the market

London Good Delivery turns a valuable lump of metal into a bar with defined specifications, identifiable markings and a place in wholesale settlement.

Read the infographic & sources

The bar behind the market. London Good Delivery. A wholesale standard for gold bars. Weight, purity and markings all matter.

Illustrative bar, not an authenticated product or a dimensional drawing. The permitted ounce range refers to fine-gold content, not gross bar weight.

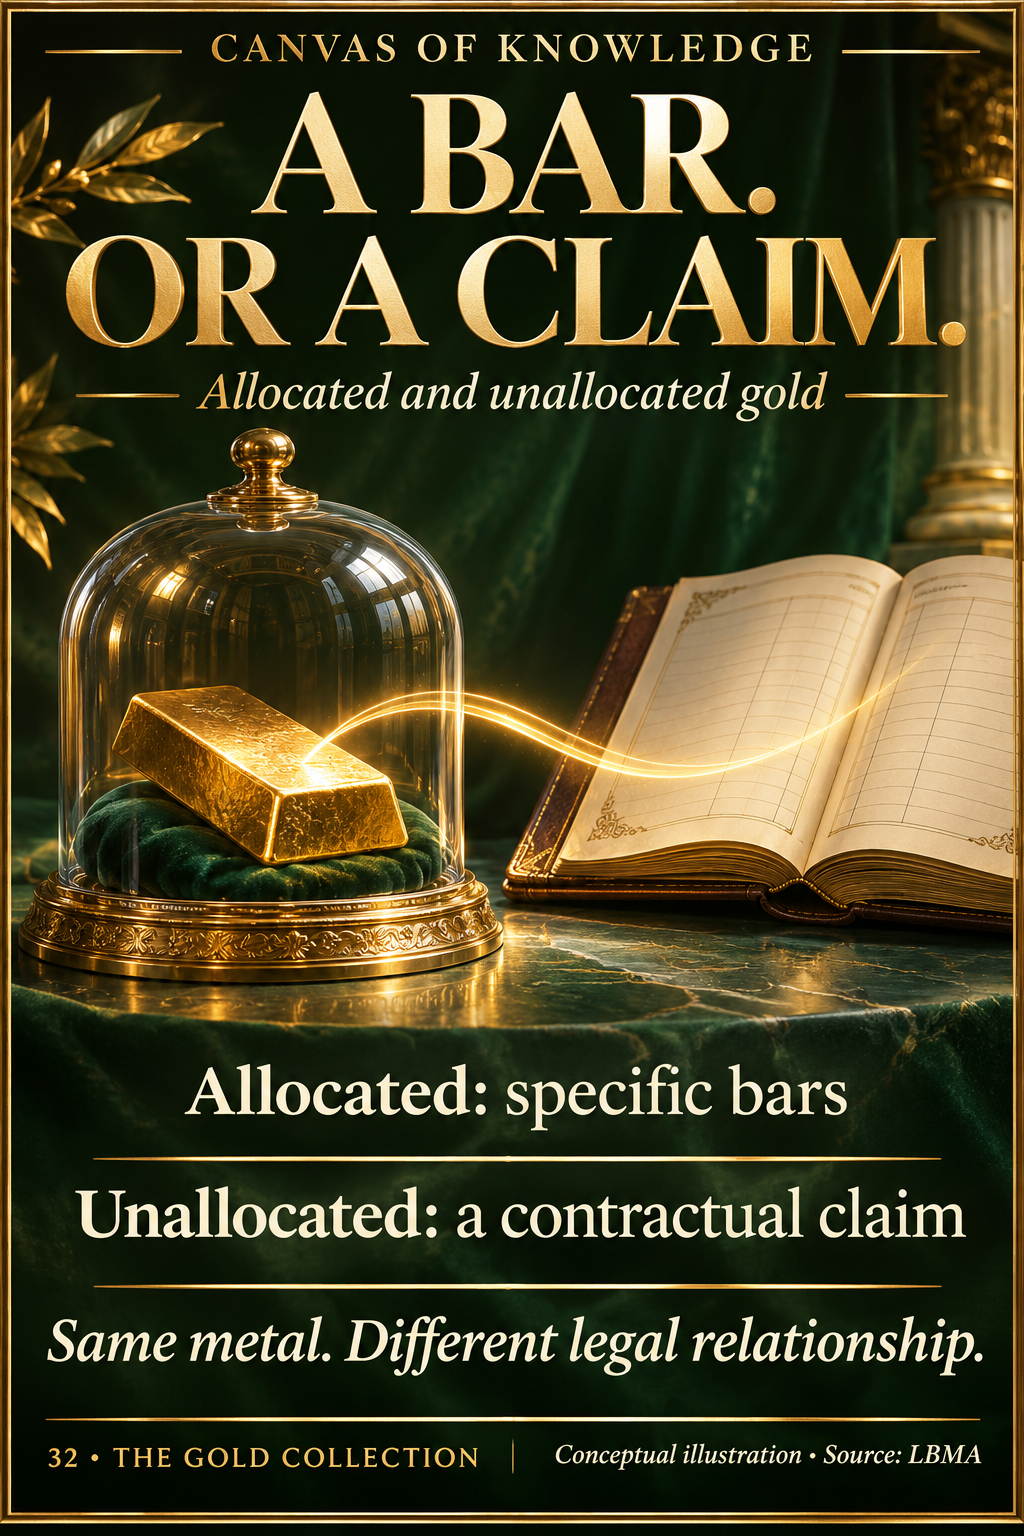
A numbered gold bar sits beside an account ledger in a quiet vault, contrasting a physical holding with an account claim.View full infographic
32 / 60

A bar. Or a claim.

Allocated and unallocated gold accounts can refer to the same metal while creating different relationships between the customer, the bars and the account provider.

Read the infographic & sources

A bar. Or a claim. Allocated and unallocated gold. Allocated: specific bars. Unallocated: a contractual claim. Same metal. Different legal relationship.

Conceptual illustration. The bar and ledger do not document a real account. Rights, custody arrangements, charges and access depend on the applicable agreement.

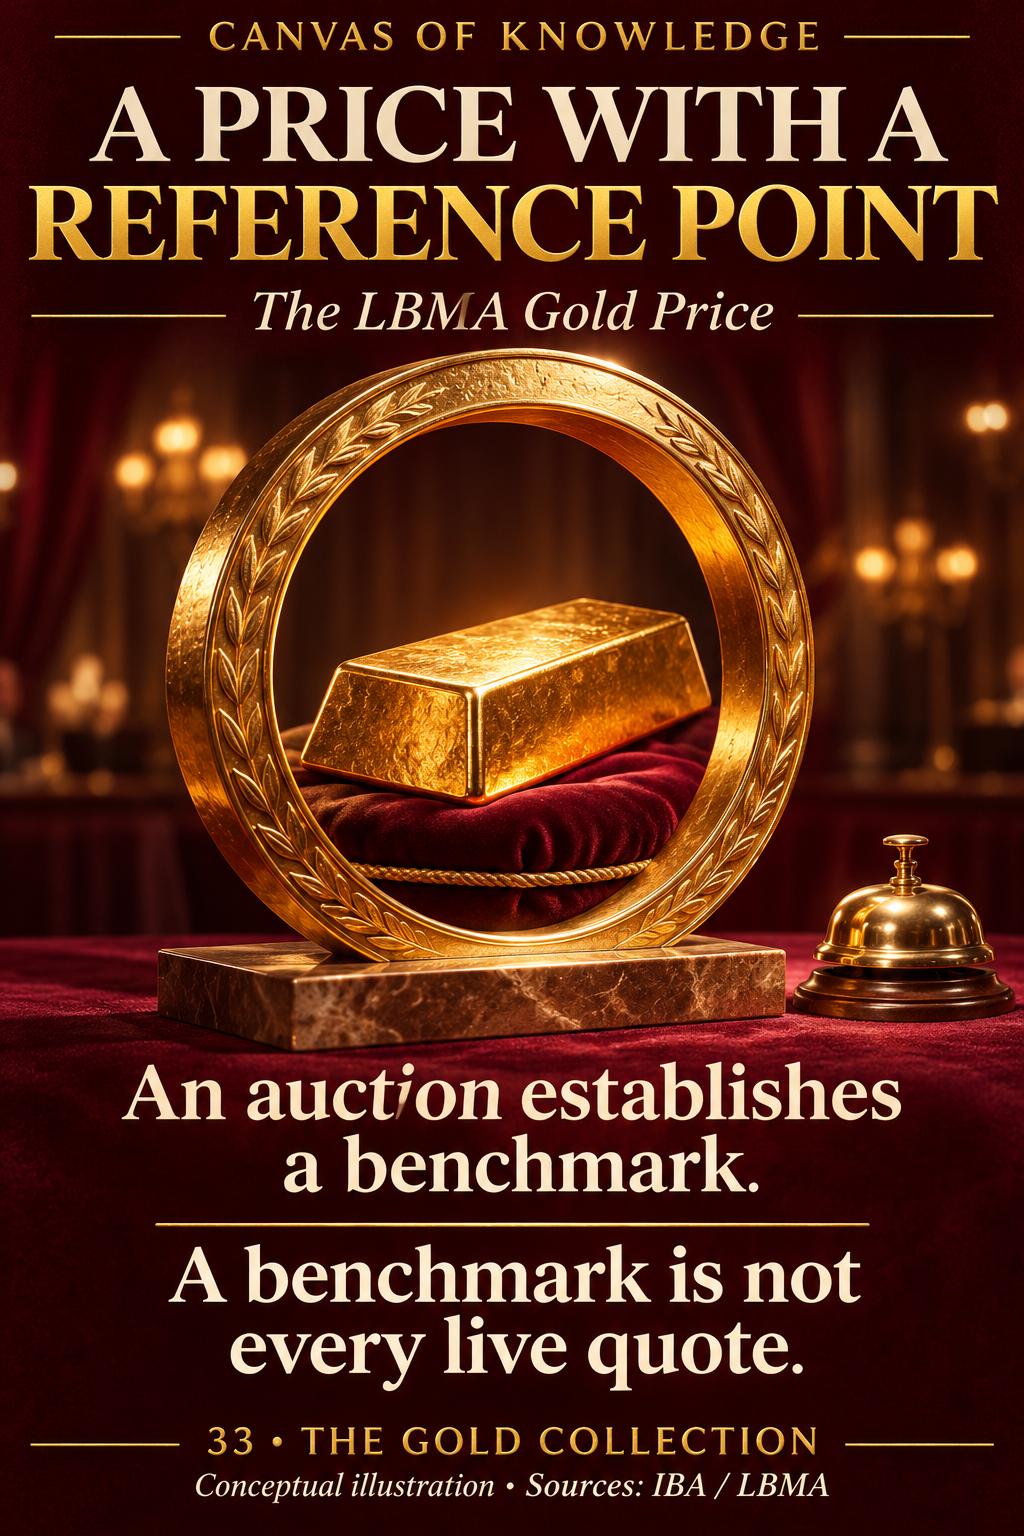
A gold bar and a carefully lit clock sit in a refined London-inspired auction setting with no numerical price display.View full infographic
33 / 60

A price with a reference point

The LBMA Gold Price provides a named auction benchmark. Understanding what it measures helps separate that reference from a live dealer quote or a retail price.

Read the infographic & sources

A price with a reference point. The LBMA Gold Price. An auction establishes a benchmark. A benchmark is not every live quote.

Illustrative setting, not a depiction of the electronic auction platform. The artwork does not display a live quotation or an actual benchmark setting.

A gold bar bridges a discreet vault interior and a modern trading room, evoking different market structures without a literal geographic map.View full infographic
34 / 60

One metal. Different markets.

London bullion dealing and COMEX gold futures connect participants to gold through different contract, settlement and clearing arrangements.

Read the infographic & sources

One metal. Different markets. London: over-the-counter dealing. COMEX: standardised gold futures. Know the contract. Know the market.

Conceptual illustration, not a map, trading screen or depiction of an actual institution. London and COMEX are not the only gold markets.

Gold bars pass from a protected vault towards a softly lit industrial doorway beside a restrained lending document.View full infographic
35 / 60

When gold is lent

A bar does not pay a coupon simply by sitting in a vault. Lending metal can create income, but it also creates a repayment obligation and exposure to the borrower.

Read the infographic & sources

When gold is lent. Metal today. Repayment later. Lending can earn interest. It also creates borrower credit risk.

Conceptual illustration, not an offer or recommendation to lend gold. Actual terms, collateral, eligibility and repayment arrangements depend on the agreement.

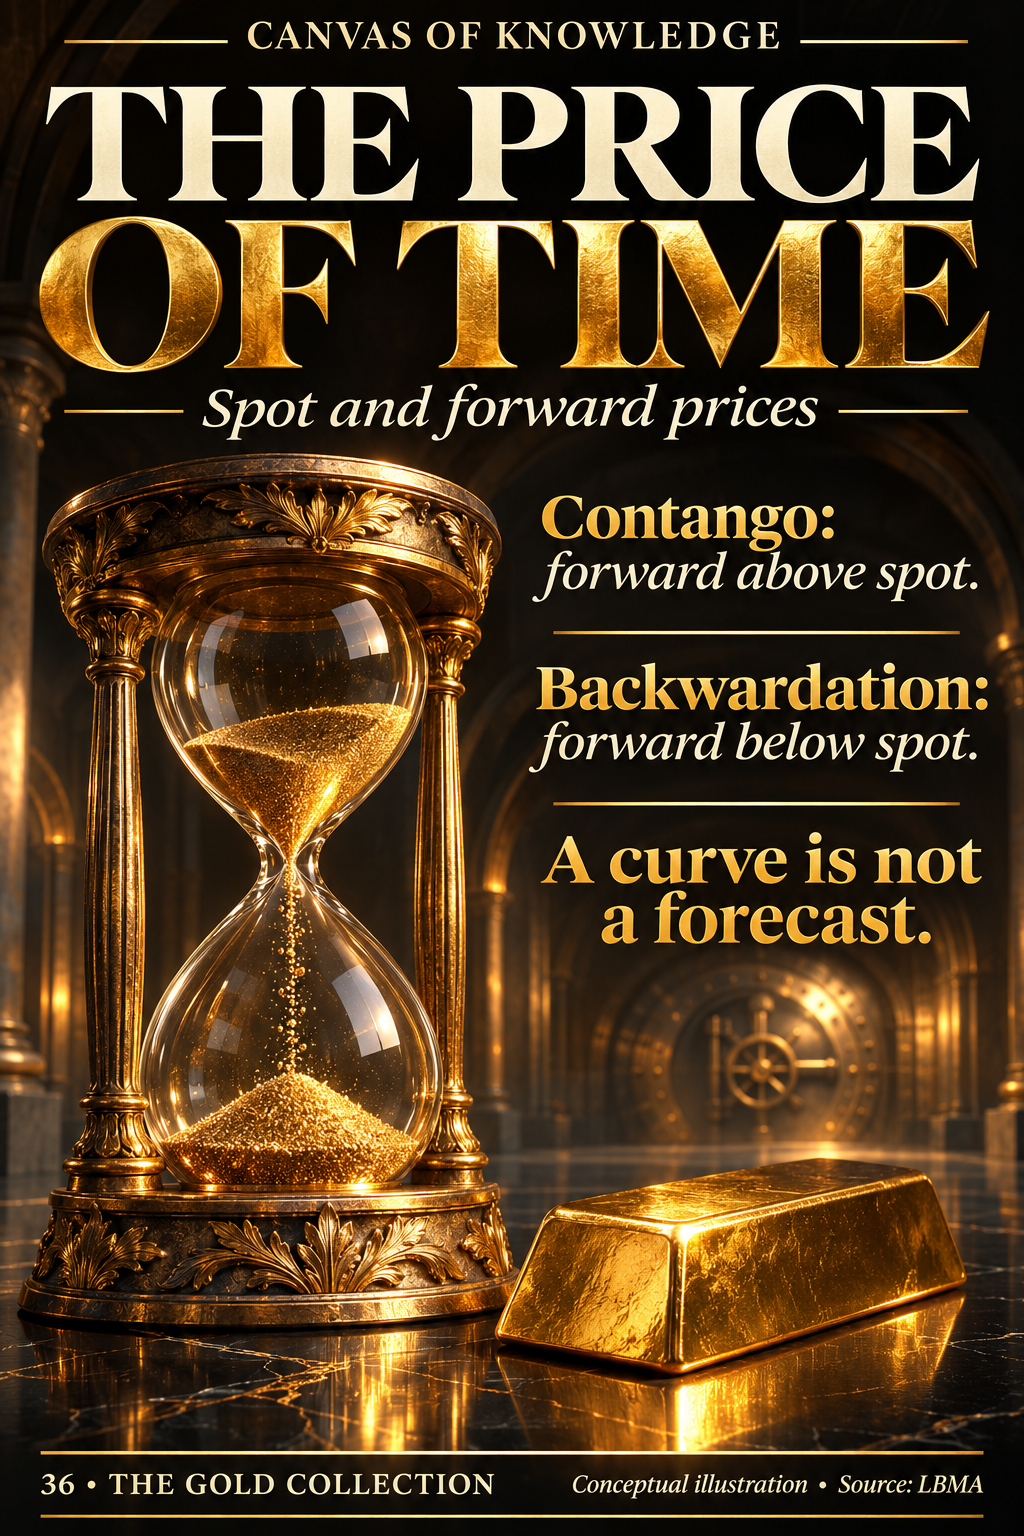
An hourglass beside a gold bar and a softly lit vault evokes the time and cost involved in carrying bullion.View full infographic
36 / 60

The price of time

Why gold for later delivery can carry a different price from gold available now—and why that difference is not a forecast.

Read the infographic & sources

The price of time. Spot and forward prices. Contango: forward above spot. Backwardation: forward below spot. A curve is not a forecast.

Conceptual still life. The hourglass and bullion do not encode market data. Numerical examples in the article are hypothetical.

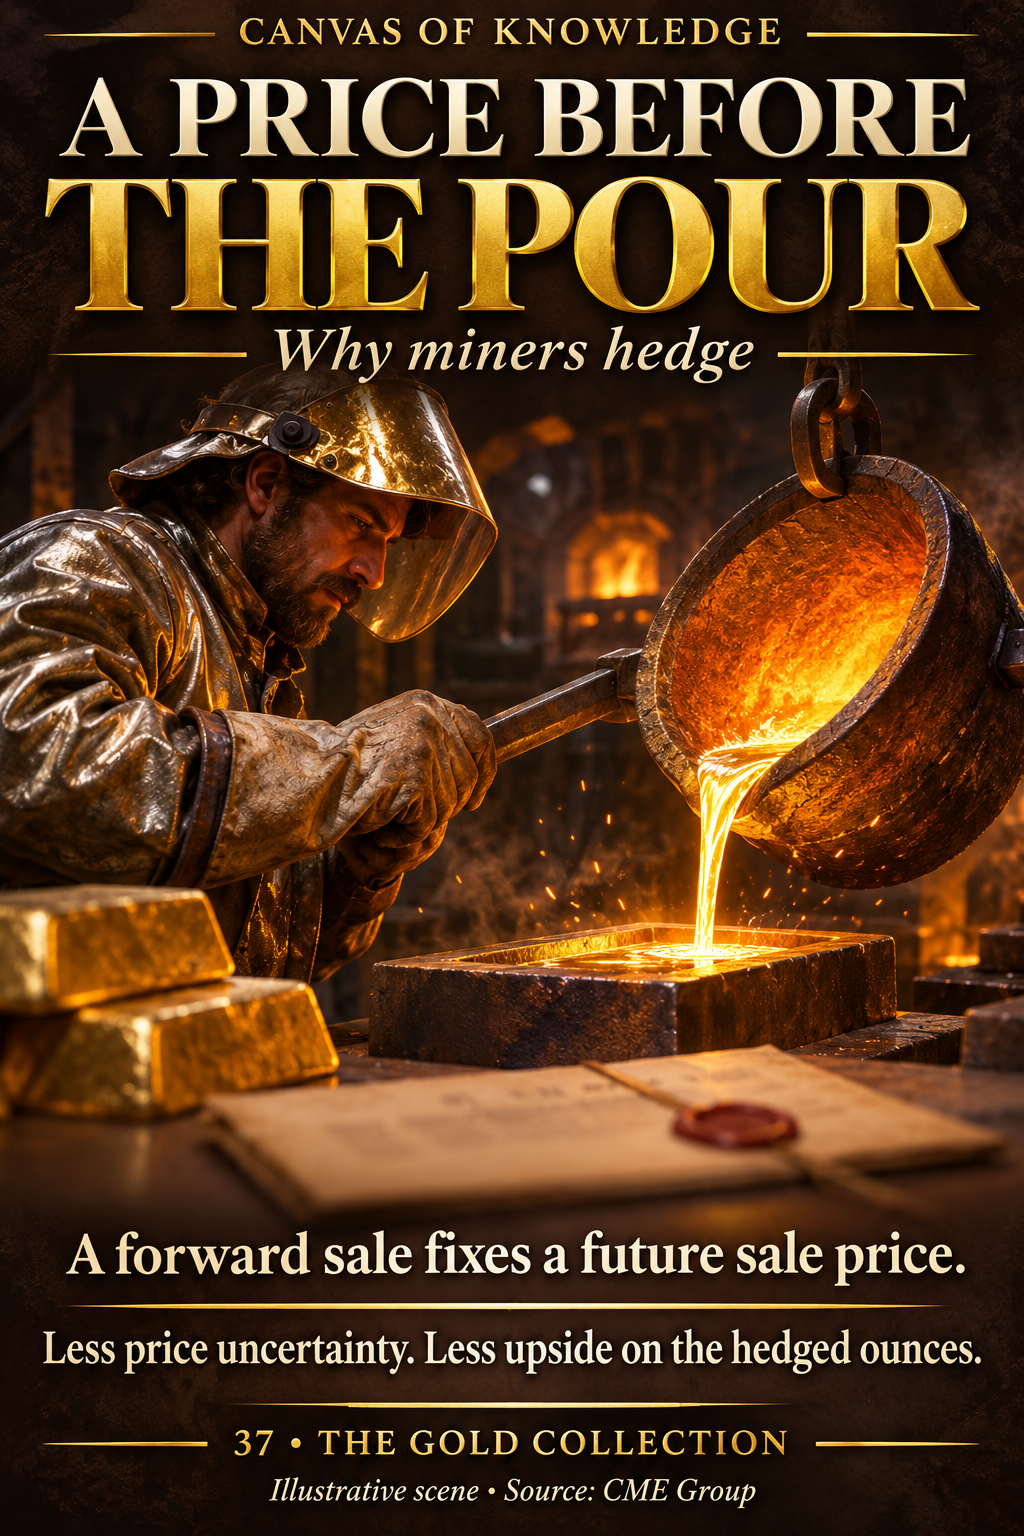
An illustrated gold pour beside a sealed sales agreement represents a miner arranging a price before future production is delivered.View full infographic
37 / 60

A price before the pour

A miner can agree a selling price before its gold reaches the market. That reduces one uncertainty while leaving others in place.

Read the infographic & sources

A price before the pour. Why miners hedge. A forward sale fixes a future sale price. Less price uncertainty. Less upside on the hedged ounces.

Illustrative scene, not an identified mine or actual agreement. The quantities and prices in the article are hypothetical.

An open gold-lit doorway with a key and a contract symbolises the choice an option gives its buyer.View full infographic
38 / 60

A right. Not an obligation.

The difference between owning an option and writing one explains why the two sides have very different risks.

Read the infographic & sources

A right. Not an obligation. Understanding gold options. Buyers pay a premium. Calls and puts confer different rights. Option sellers accept obligations.

Visual metaphor, not a contract document or payoff diagram. The article discusses options on gold futures and uses hypothetical figures.

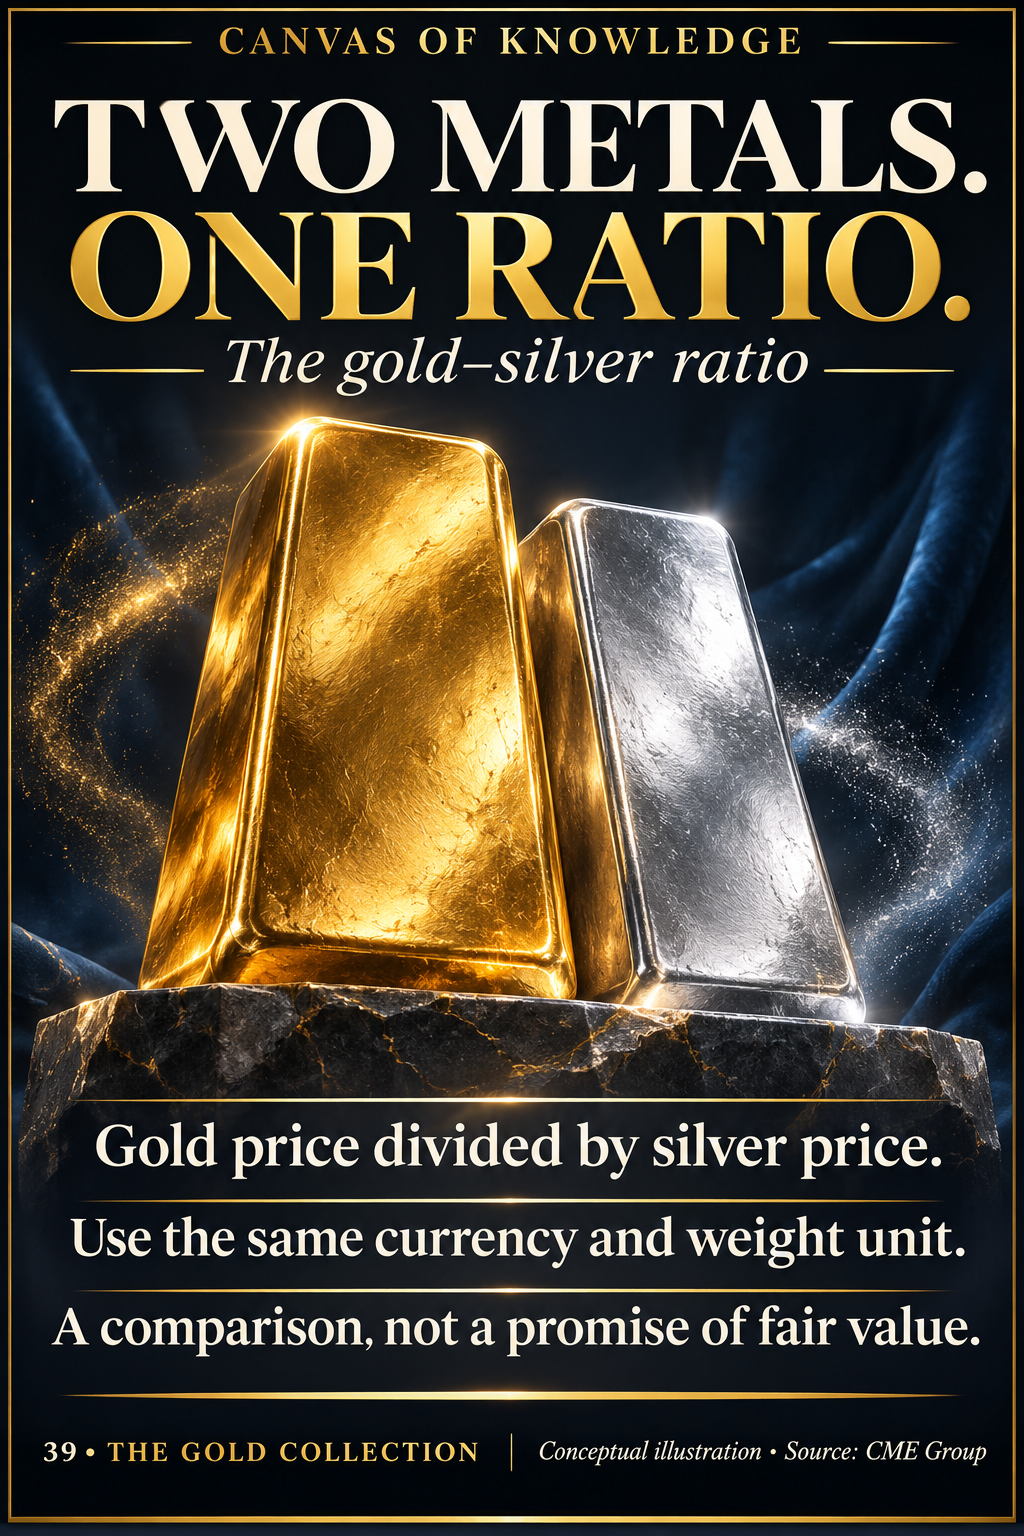
A gold ingot and a silver ingot in a dramatic contrasting still life evoke two precious metals with different market drivers.View full infographic
39 / 60

Two metals. One ratio.

A simple division compares gold with silver, but the answer cannot tell you which metal is fairly priced.

Read the infographic & sources

Two metals. One ratio. The gold–silver ratio. Gold price divided by silver price. Use the same currency and weight unit. A comparison, not a promise of fair value.

Illustrative metal objects are not drawn to a quantity or value scale. Every price used in the article is hypothetical.

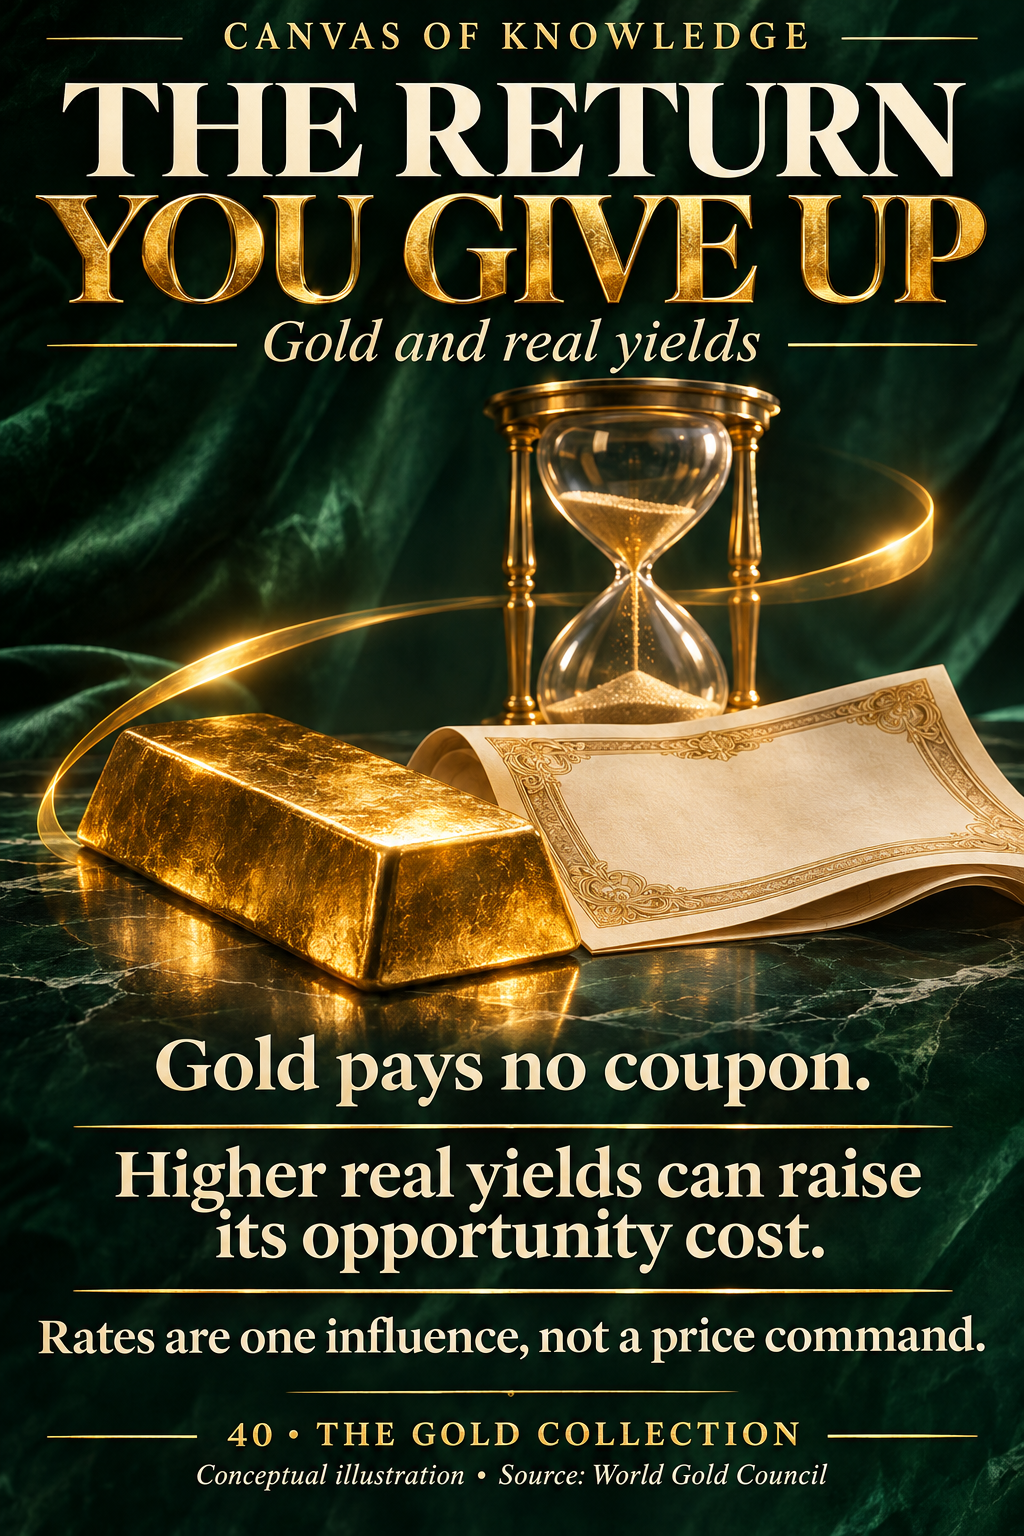
A gold bar beside an empty payout tray and a softly lit bond document evokes the return forgone when holding a non-coupon asset.View full infographic
40 / 60

The return you give up

Gold’s lack of a coupon makes competing real yields relevant, but interest rates never explain the entire market.

Read the infographic & sources

The return you give up. Gold and real yields. Gold pays no coupon. Higher real yields can raise its opportunity cost. Rates are one influence, not a price command.

Conceptual still life, not a measured chart or forecast. Interest-rate numbers in the article are hypothetical.

CHAPTER 05 / 41—50

Beyond the vault

Ten illustrated articles on craftsmanship, authenticity, responsible sourcing and the surprising science of gold.

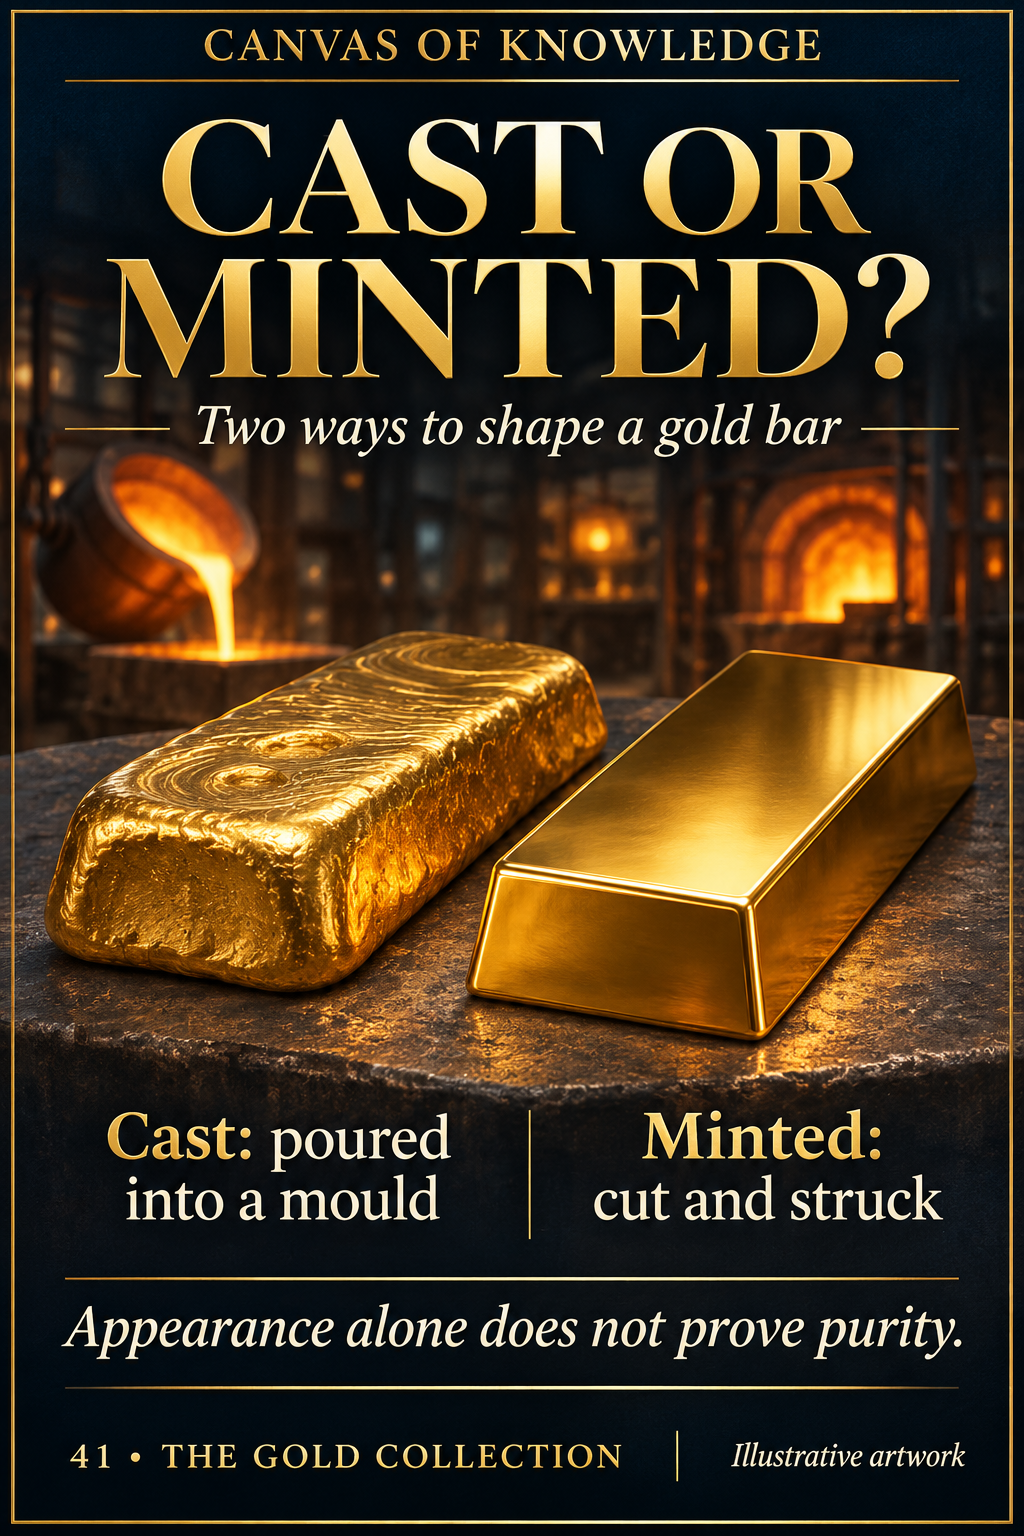
A softly textured cast gold bar and a sharply finished minted bar rest together under a warm workshop light.View full infographic
41 / 60

Cast or minted?

Two bars can hold the same amount of fine gold while looking very different. The distinction begins with how the metal is shaped and finished.

Read the infographic & sources

Cast or minted? Two ways to shape a gold bar. Cast: poured into a mould. Minted: cut and struck. Appearance alone does not prove purity.

Illustrative bars, not authenticated products. Their pictured sizes do not imply equal weight or purity.

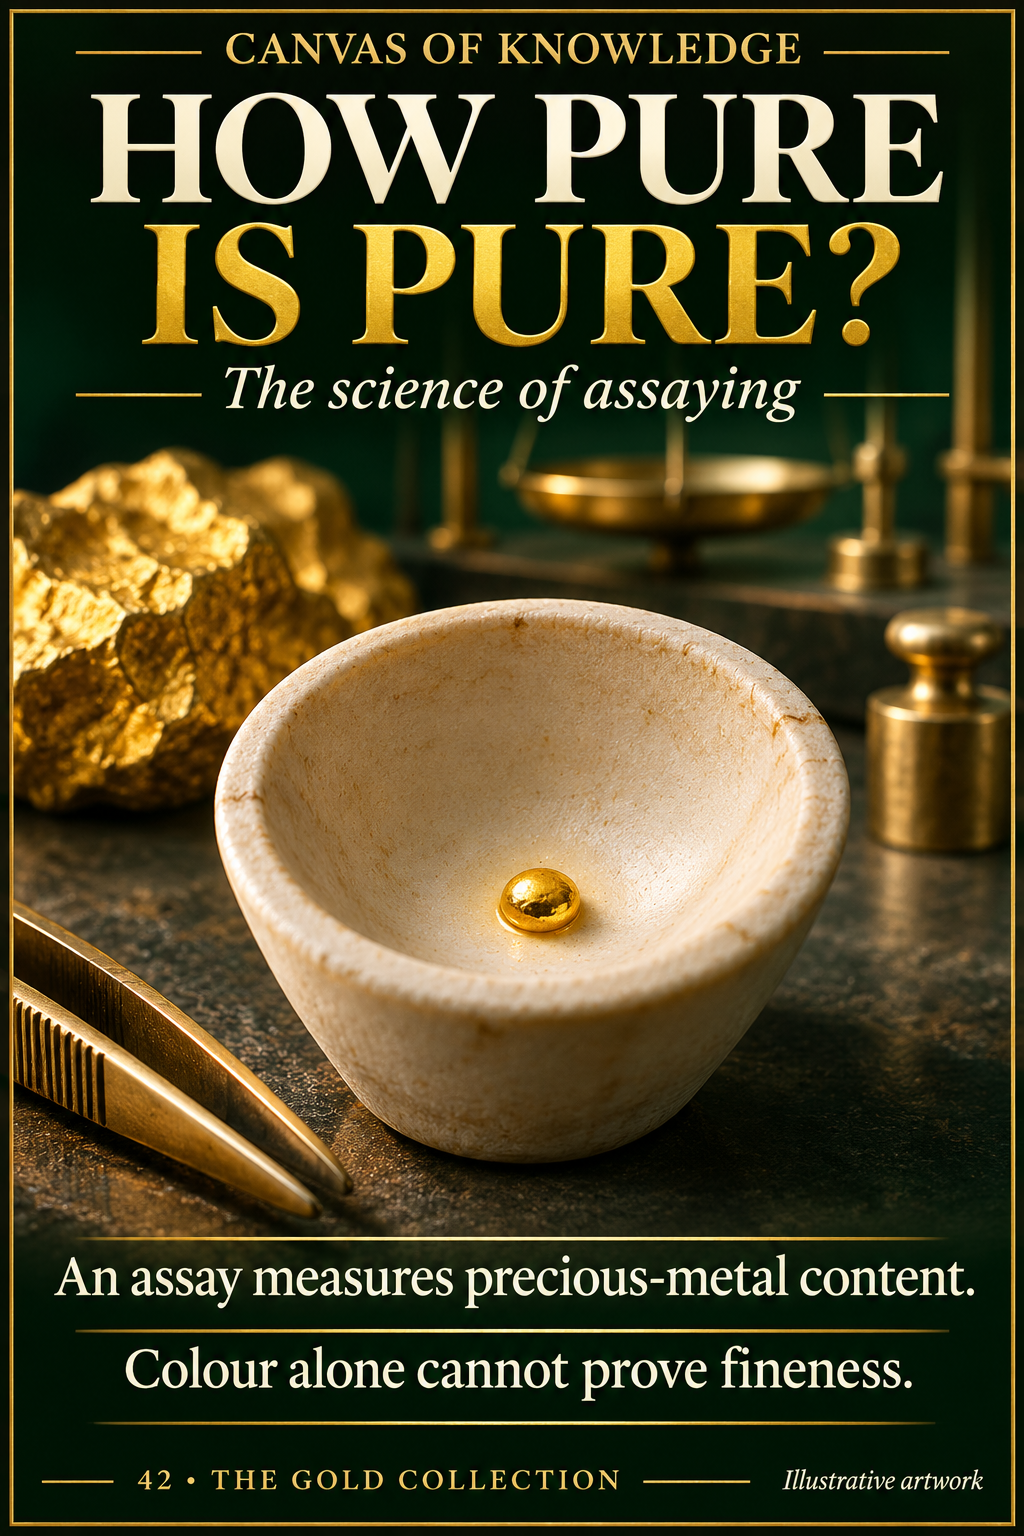
A tiny gold assay bead sits in a white ceramic cup on a laboratory bench, with a gold sample and precision balance behind it.View full infographic
42 / 60

How pure is pure?

Assaying turns a claim about gold content into a measurement. The strength of the result depends on both the analytical method and the sample it examines.

Read the infographic & sources

How pure is pure? The science of assaying. An assay measures precious-metal content. Colour alone cannot prove fineness.

Conceptual laboratory illustration, not a testing procedure or proof of authenticity. Professional analytical methods require appropriate equipment and controls.

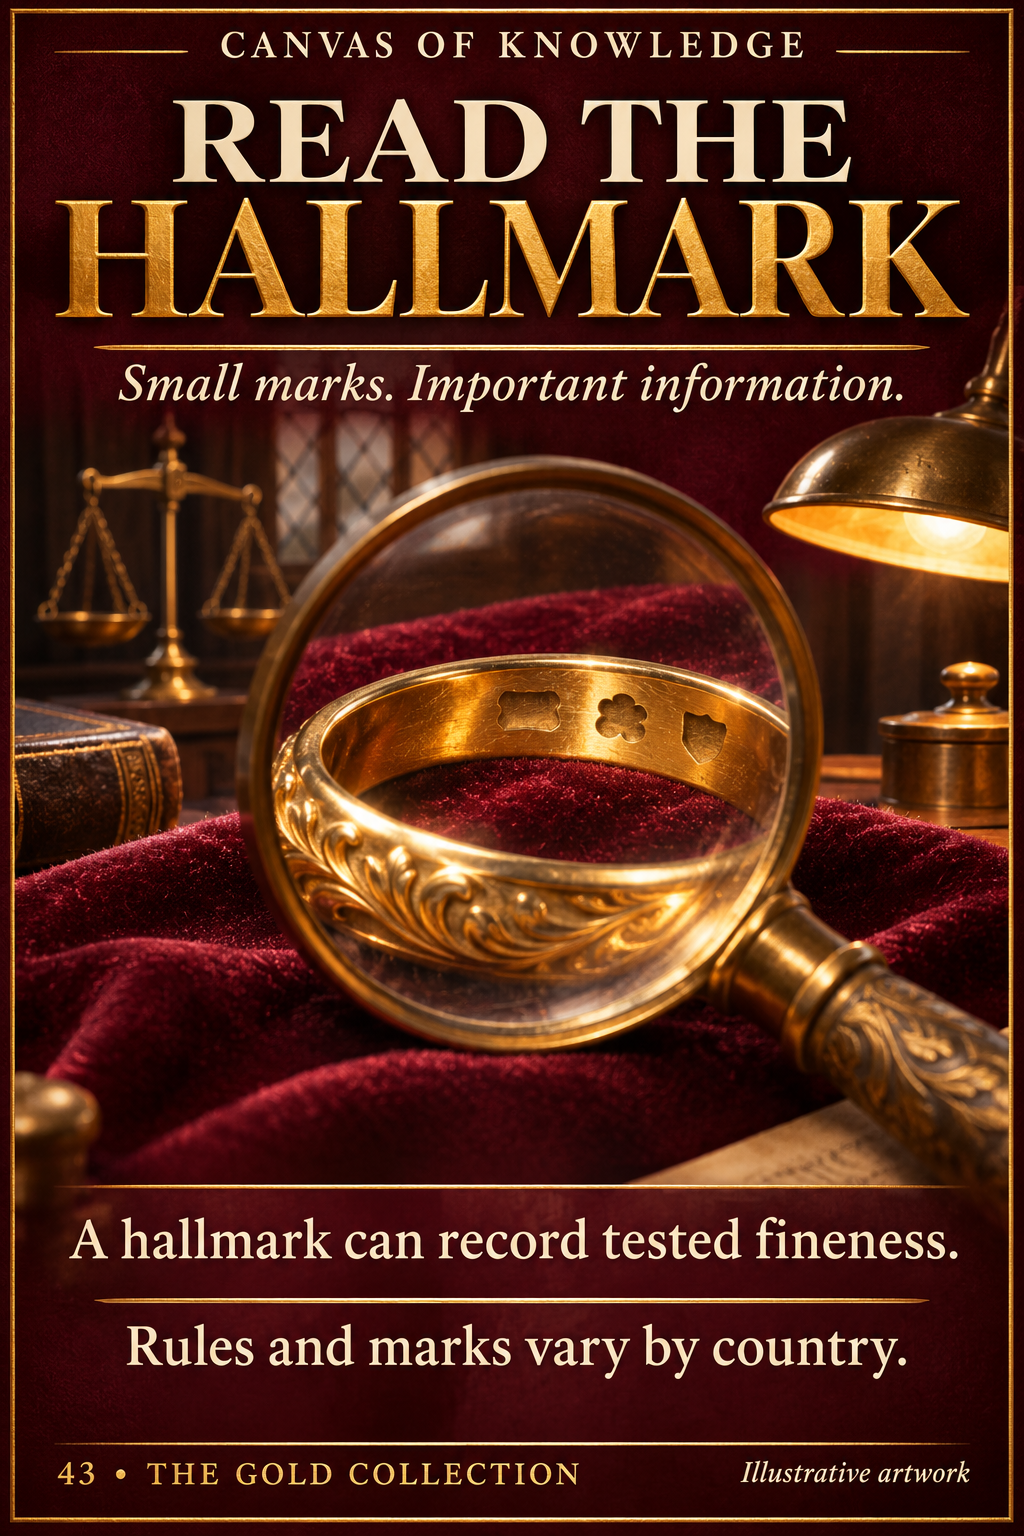
A jeweller’s loupe enlarges a small marked area inside a gold ring, with no attempt to reproduce an official hallmark.View full infographic
43 / 60

Read the hallmark

A small set of marks can carry an independent statement about a precious-metal item. Reading it properly requires knowing the system behind it.

Read the infographic & sources

Read the hallmark. Small marks. Important information. A hallmark can record tested fineness. Rules and marks vary by country.

Conceptual jewellery illustration. No pictured symbol is an authenticated hallmark. The article uses the UK as an example; requirements vary by jurisdiction.

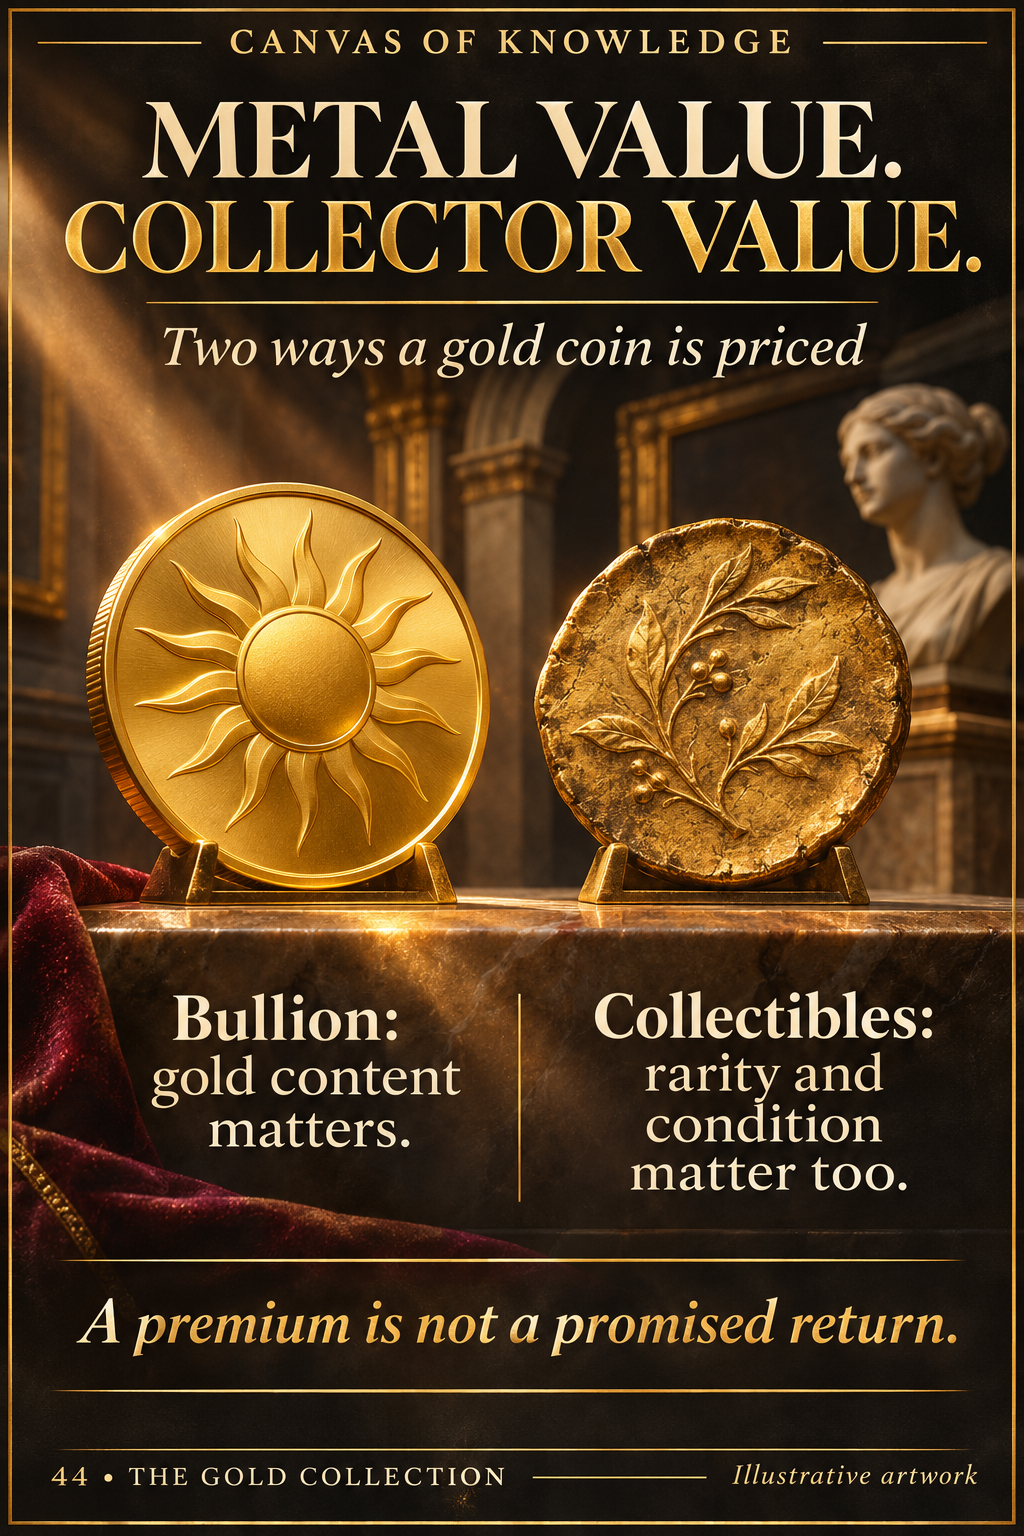
A simple gold bullion coin and a richly detailed collectible coin are displayed beside one another in a dark museum setting.View full infographic
44 / 60

Metal value. Collector value.

A gold coin can be valued for the metal it contains and for the object it is. Those two sources of appeal need not move together.

Read the infographic & sources

Metal value. Collector value. Two ways a gold coin is priced. Bullion: gold content matters. Collectibles: rarity and condition matter too. A premium is not a promised return.

Illustrative coins with fictional designs, not identifiable issues or valuations. No future resale price is implied.

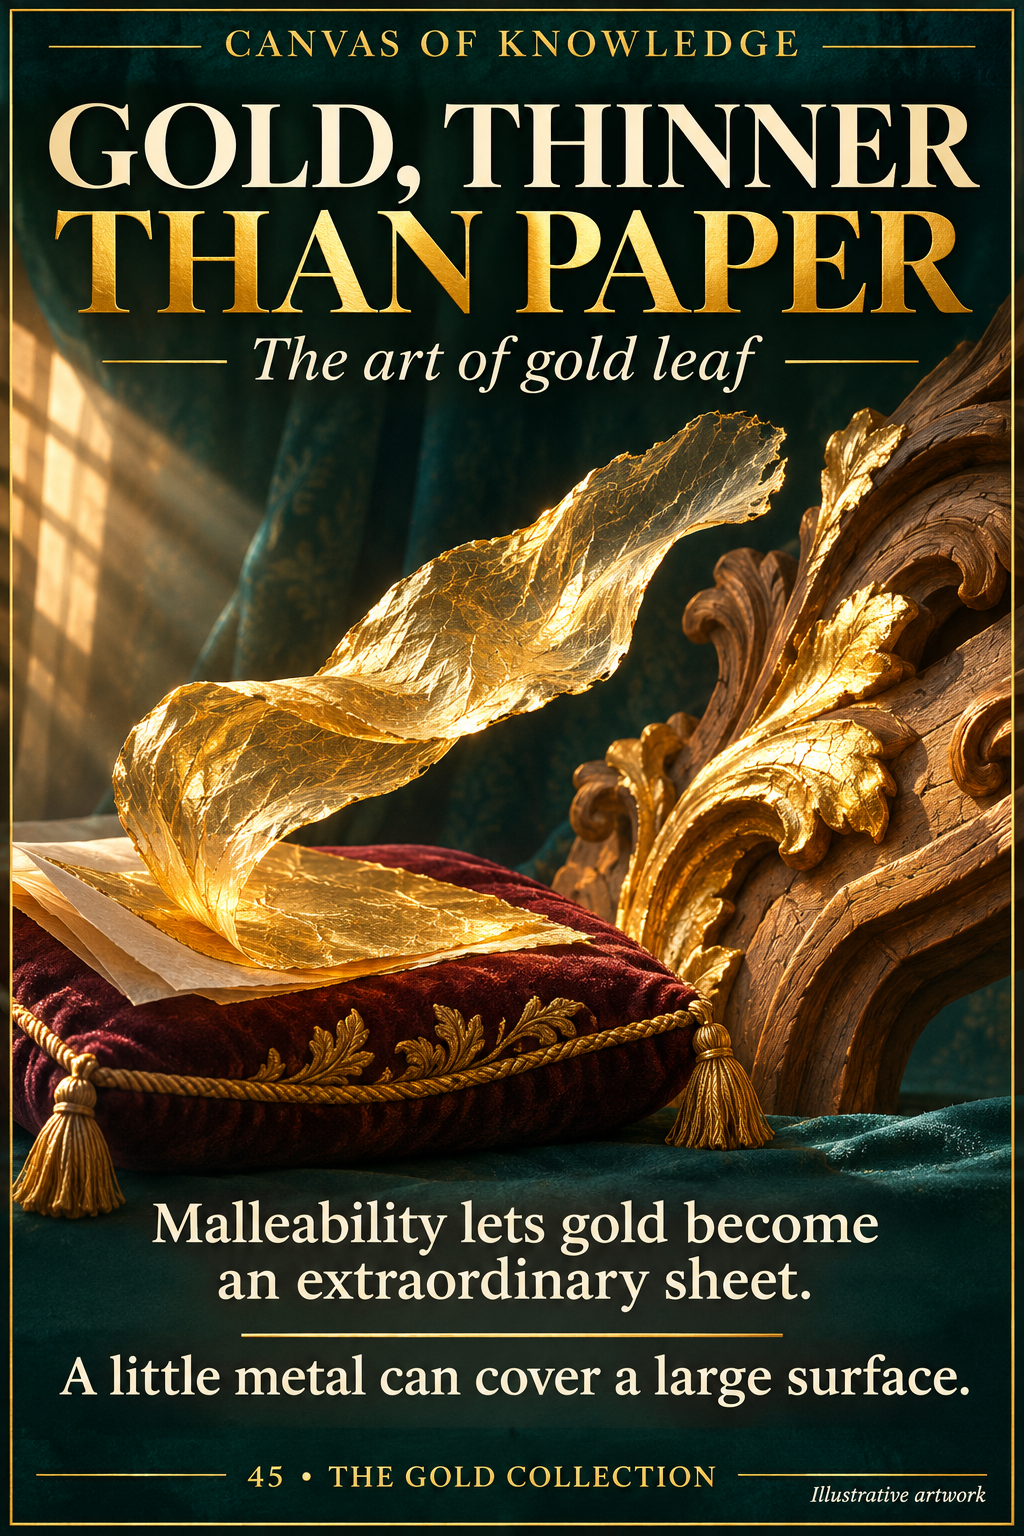
A delicate sheet of gold leaf floats above a gilding cushion, with the edge of a partially gilded frame in the background.View full infographic
45 / 60

Gold, thinner than paper

Gold’s extraordinary malleability lets a small quantity become a delicate surface. In gilding, the metal’s visual presence can be far greater than its mass suggests.

Read the infographic & sources

Gold, thinner than paper. The art of gold leaf. Malleability lets gold become an extraordinary sheet. A little metal can cover a large surface.

Illustrative craft scene, not a scale drawing. Leaf thickness, alloy and application methods vary; no numerical thickness is implied.

A close-up illustration of gold-plated connector contacts emerging from a dark circuit board.View full infographic
46 / 60

A tiny contact. A vital connection.

Gold can earn its place inside a device through a very thin coating. The useful combination is electrical conductivity and a surface that resists corrosion.

Read the infographic & sources

A tiny contact. A vital connection. Gold inside electronics. Corrosion resistance helps contacts stay reliable. Gold is useful—not the best electrical conductor.

Illustrative close-up, not a circuit design or a scale drawing. Gold-coloured components are not necessarily solid gold.

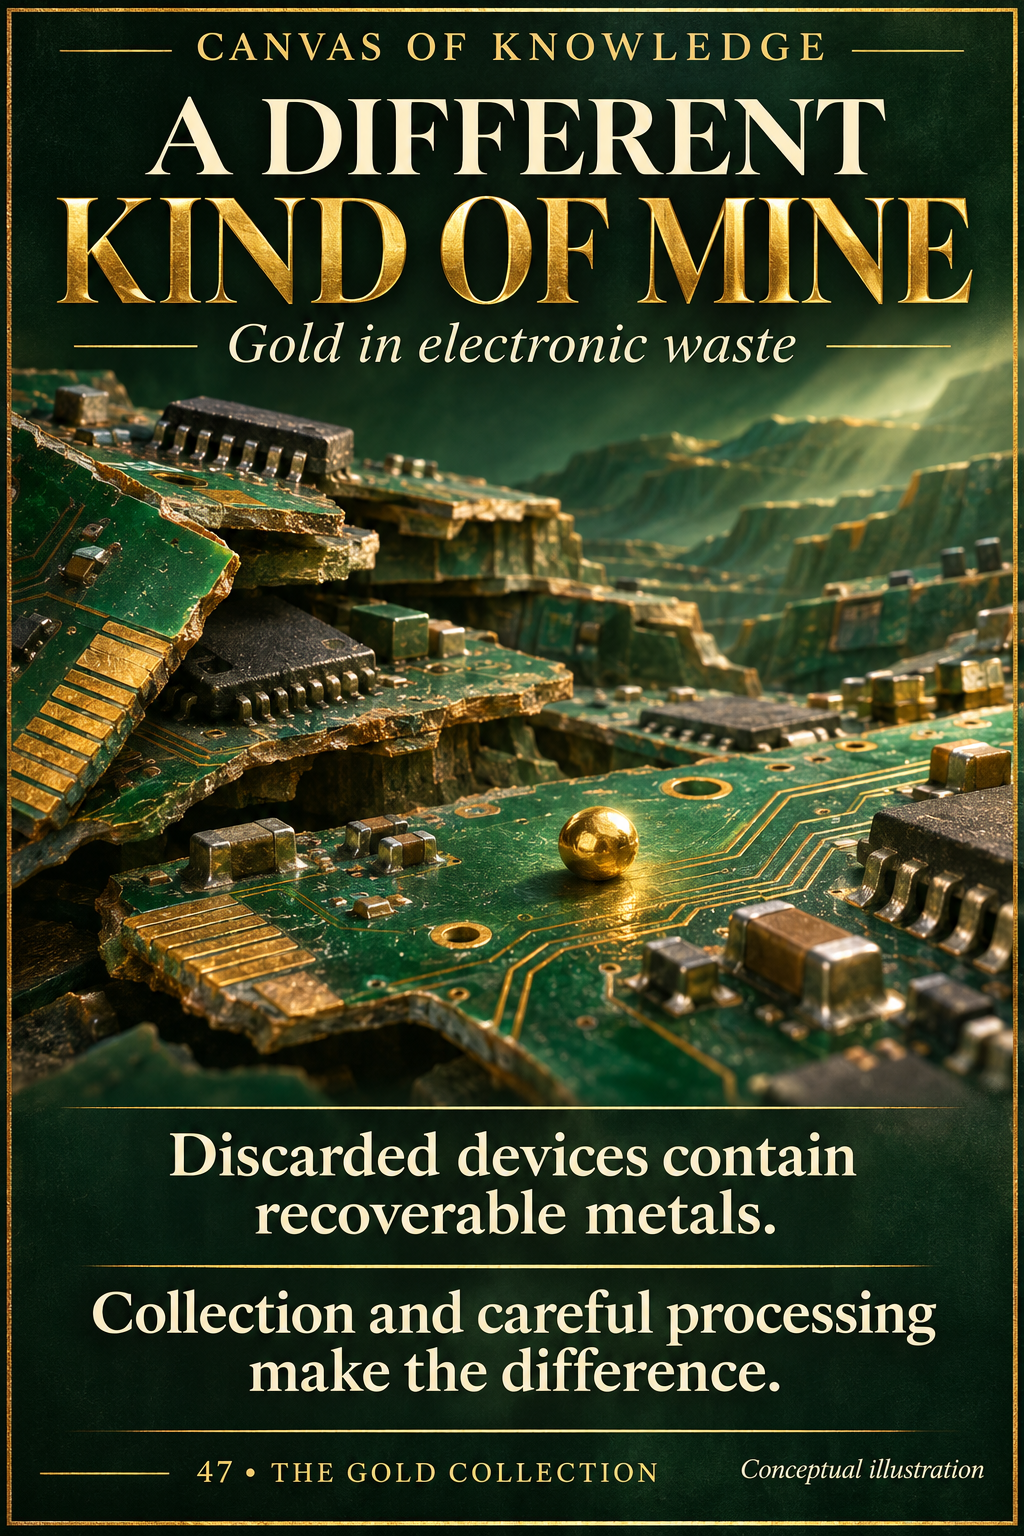
Discarded circuit boards and old electronic components appear beside recovered metal in a controlled recycling setting.View full infographic
47 / 60

A different kind of mine

Discarded electronics contain valuable metals, including gold. Turning that potential into useful material depends on collection systems and controlled industrial recovery.

Read the infographic & sources

A different kind of mine. Gold in electronic waste. Discarded devices contain recoverable metals. Collection and careful processing make the difference.

Conceptual illustration, not a statement about the gold content of a particular device or a guide to extracting metals at home.

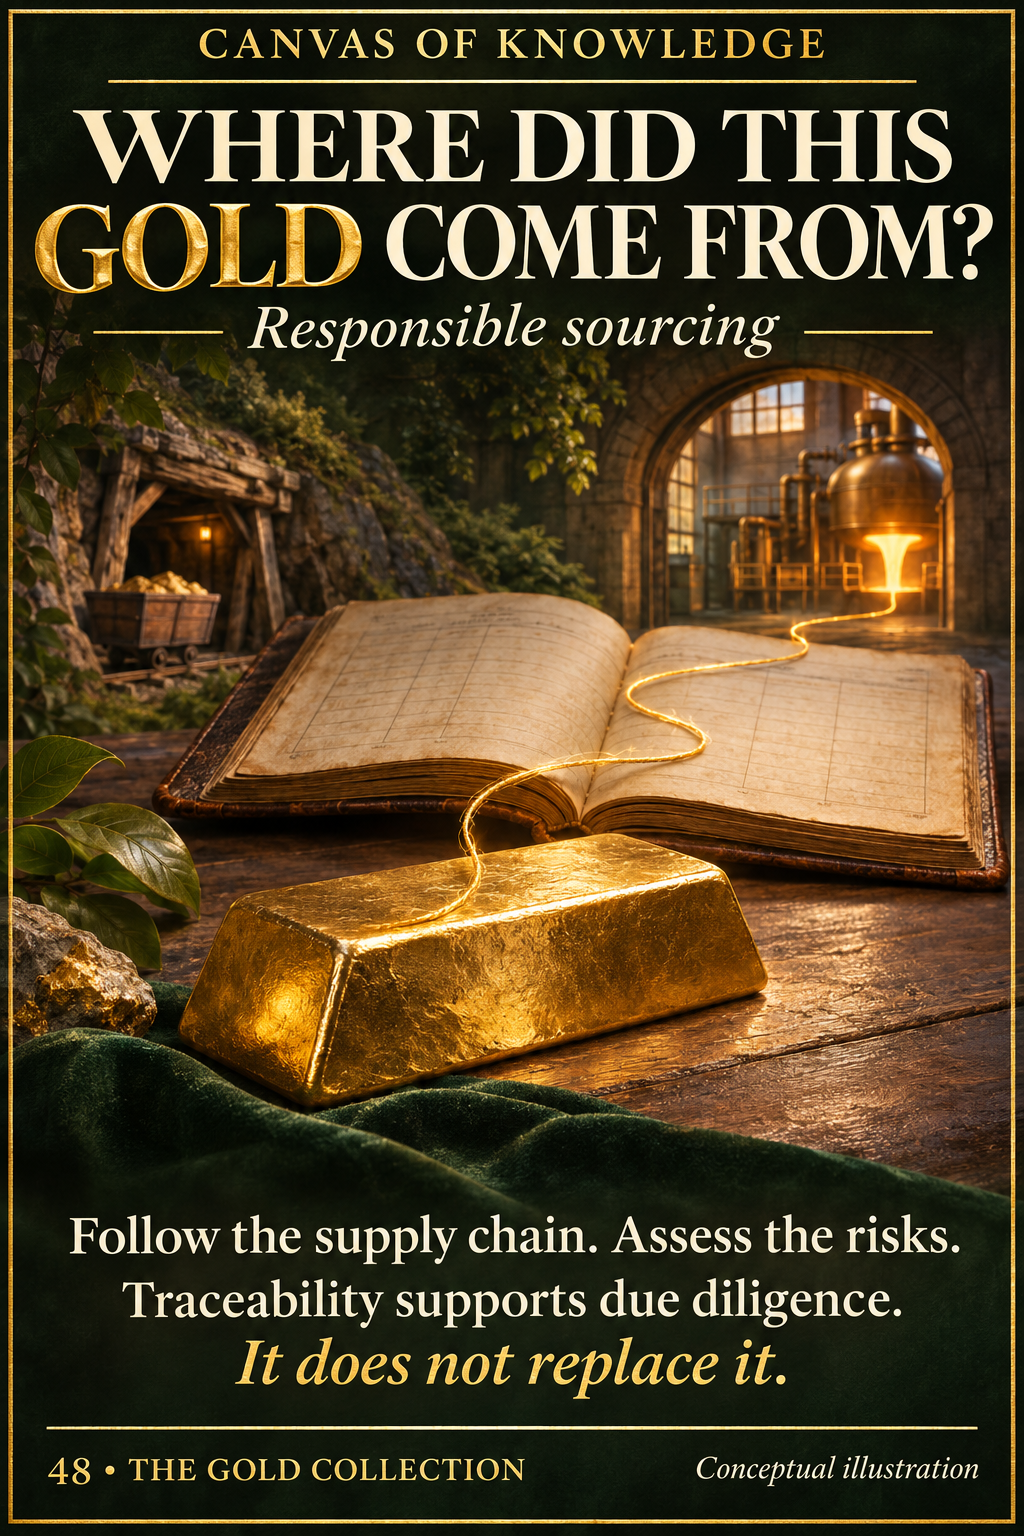
A golden thread leads from a gold bar across an open ledger towards a refinery, illustrating the idea of tracing a supply chain.View full infographic
48 / 60

Where did this gold come from?

A bar has a physical composition and a supply-chain history. Responsible sourcing asks how risks are identified and addressed along that history.
Read the infographic & sources

Where did this gold come from? Responsible sourcing. Follow the supply chain. Assess the risks. Traceability supports due diligence. It does not replace it.

Conceptual illustration. The documents and markings do not certify a real product, company or supply chain.

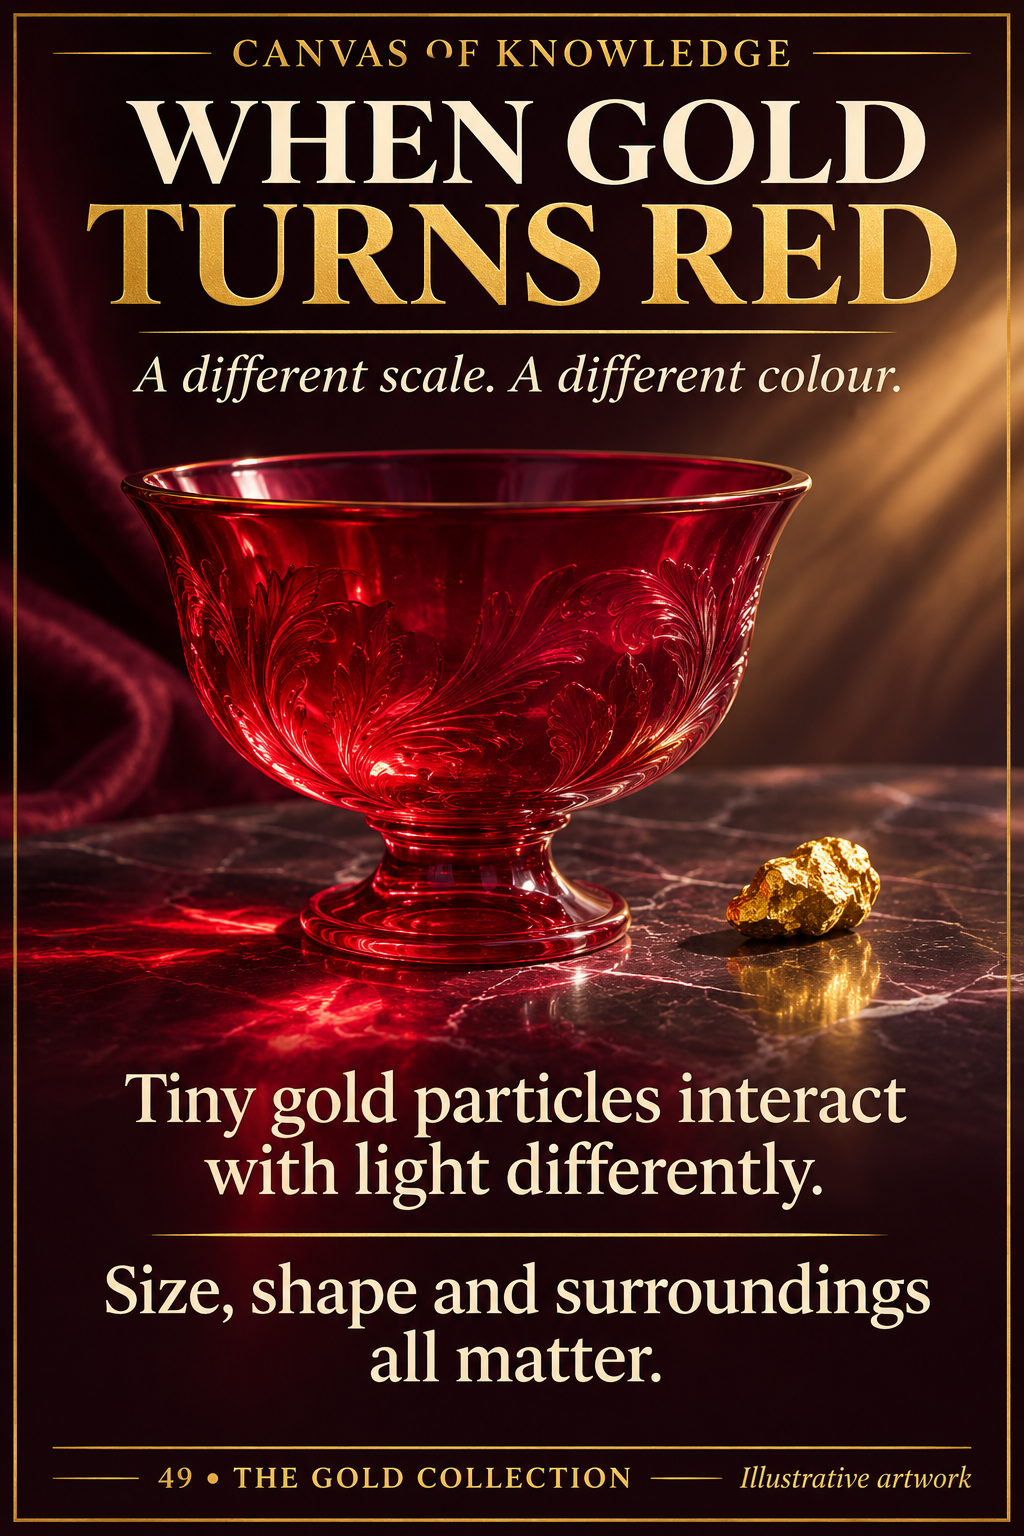
A ruby-red glass vessel glows beside a gold specimen in a conceptual still life contrasting bulk gold with glass coloured by gold particles.View full infographic
49 / 60

When gold turns red

Gold need not look golden. Tiny particles within ruby glass or suspended in a liquid interact with light differently from a solid bar.

Read the infographic & sources

When gold turns red. A different scale. A different colour. Tiny gold particles interact with light differently. Size, shape and surroundings all matter.

Illustrative glass vessel, not a particular historical object or a laboratory measurement. Not all red glass contains gold; colour alone cannot establish composition.

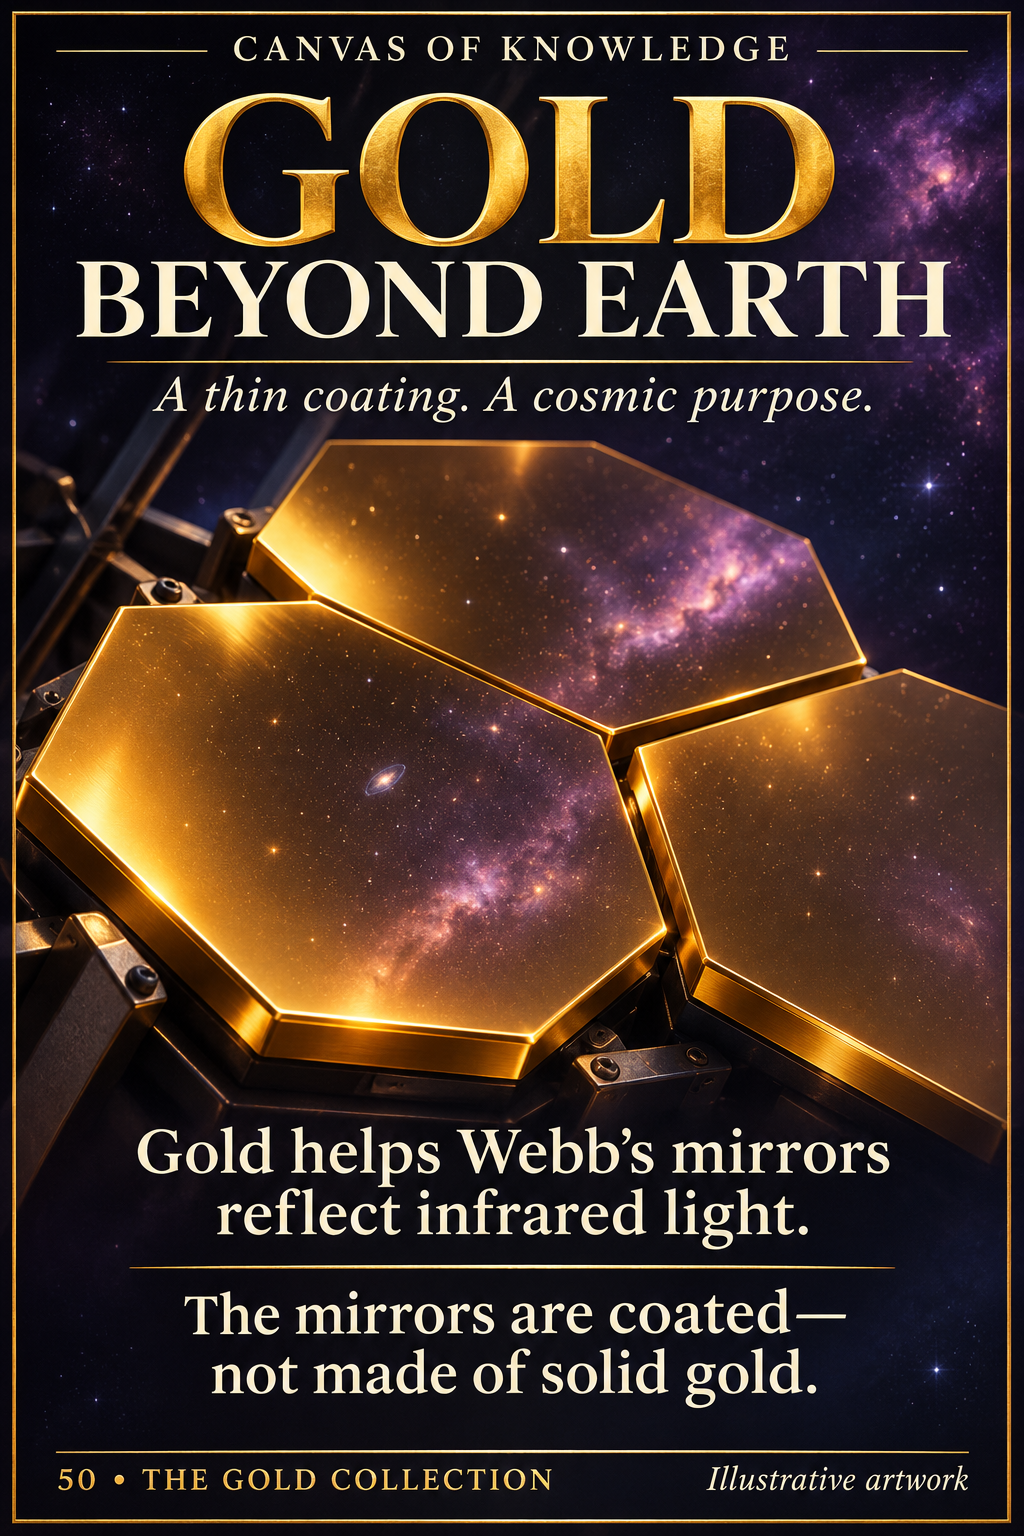
A close view of gold-coated hexagonal telescope mirror segments reflects an imagined starfield.View full infographic
50 / 60

Gold beyond Earth

The James Webb Space Telescope uses gold to help collect infrared light. Its mirrors show how a thin functional coating can matter more than a large mass of metal.

Read the infographic & sources

Gold beyond Earth. A thin coating. A cosmic purpose. Gold helps Webb’s mirrors reflect infrared light. The mirrors are coated—not made of solid gold.

Conceptual illustration inspired by space optics, not a technical drawing or a photograph of the observatory. Gold-coloured spacecraft insulation need not contain gold.

CHAPTER 06 / 51—60

Gold, understood

The final ten: cosmic origins, colour, lookalikes, environmental responsibilities and the questions worth asking.

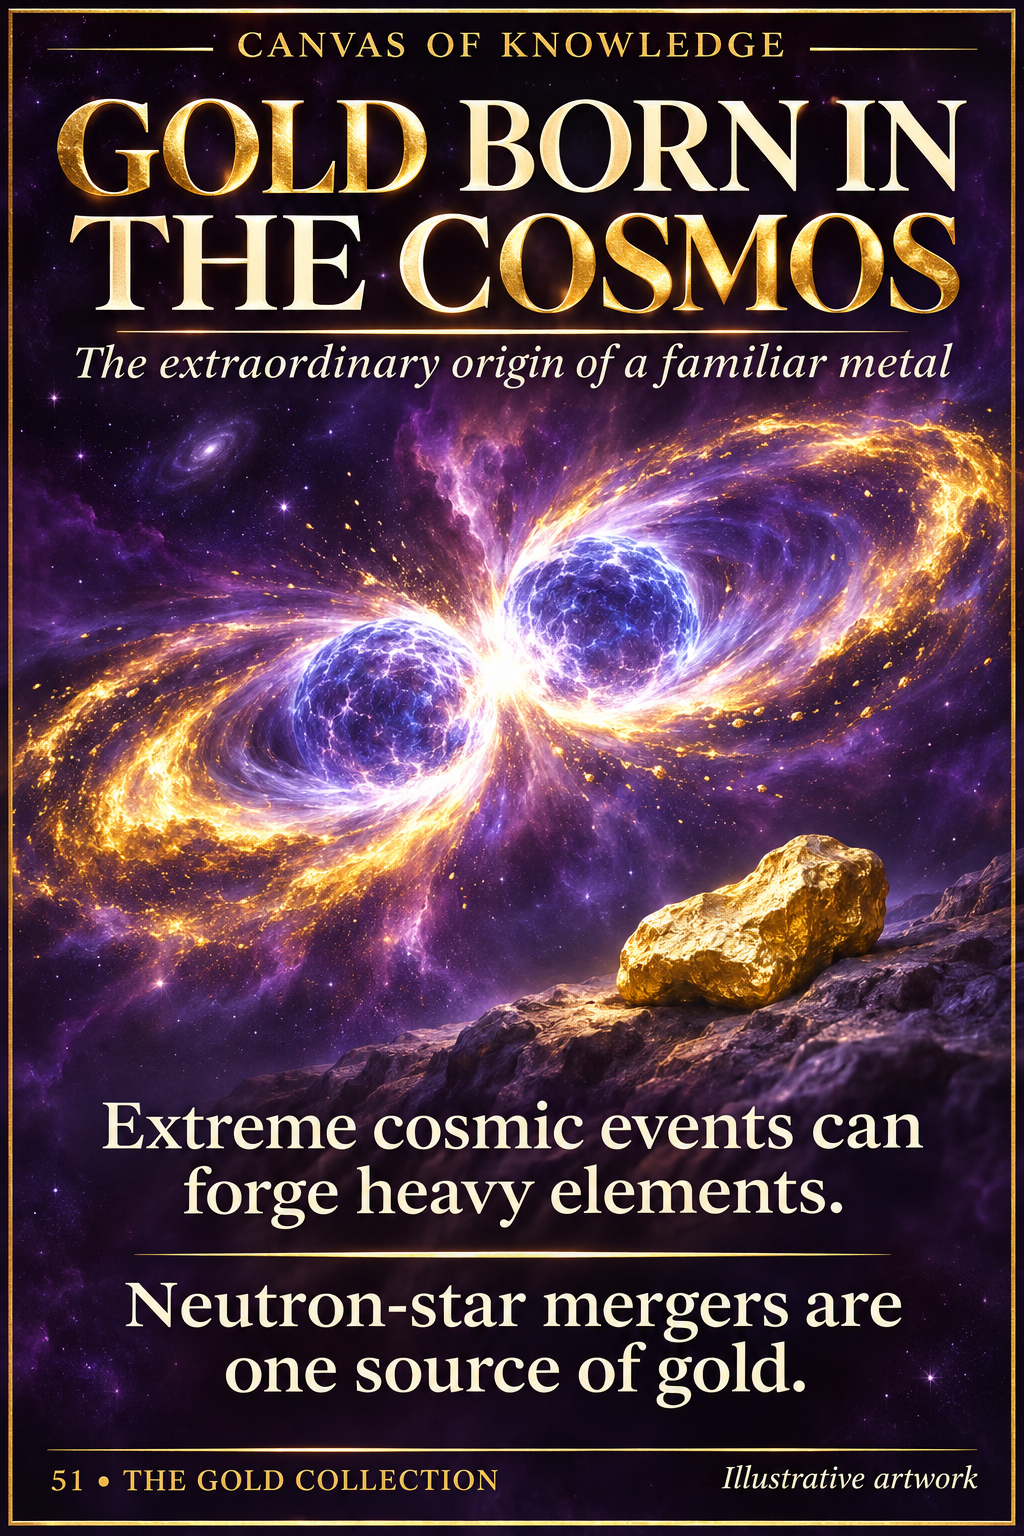
An imagined collision of two neutron stars throws luminous material into a dark star field.View full infographic
51 / 60

Gold born in the cosmos

Gold’s story reaches beyond mines and even beyond Earth. Extreme astrophysical environments can build the heavy nuclei that become this familiar metal.

Read the infographic & sources

Gold born in the cosmos The extraordinary origin of a familiar metal. Extreme cosmic events can forge heavy elements. Neutron-star mergers are one source of gold.

Artist’s concept, not a telescope photograph or a simulation. Colours and scale are illustrative; no proportion of cosmic gold is implied.

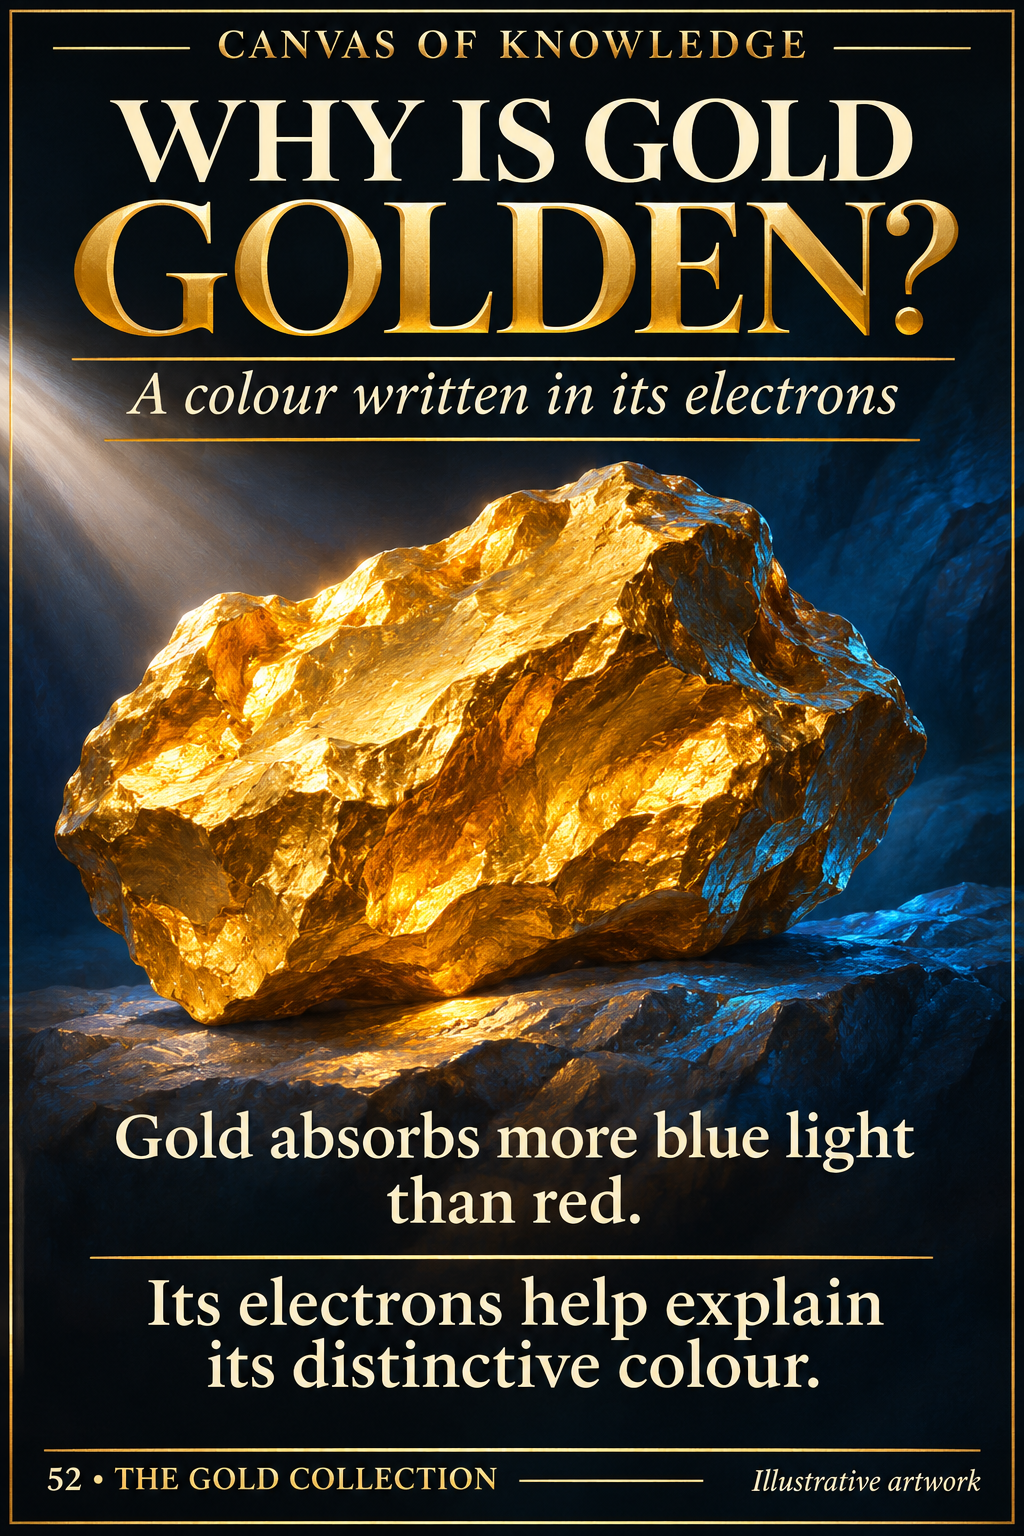
A polished gold surface catches warm reflected light while a cool blue glow evokes the light it absorbs.View full infographic
52 / 60

Why is gold golden?

Gold’s yellow appearance is a physical response to light. Its electronic structure, including relativistic effects, helps explain why it differs from silvery metals.

Read the infographic & sources

Why is gold golden? A colour written in its electrons. Gold absorbs more blue light than red. Its electrons help explain its distinctive colour.

Conceptual light study, not a measured spectrum or literal picture of electron paths. The explanation concerns ordinary bulk gold under broad-spectrum illumination.

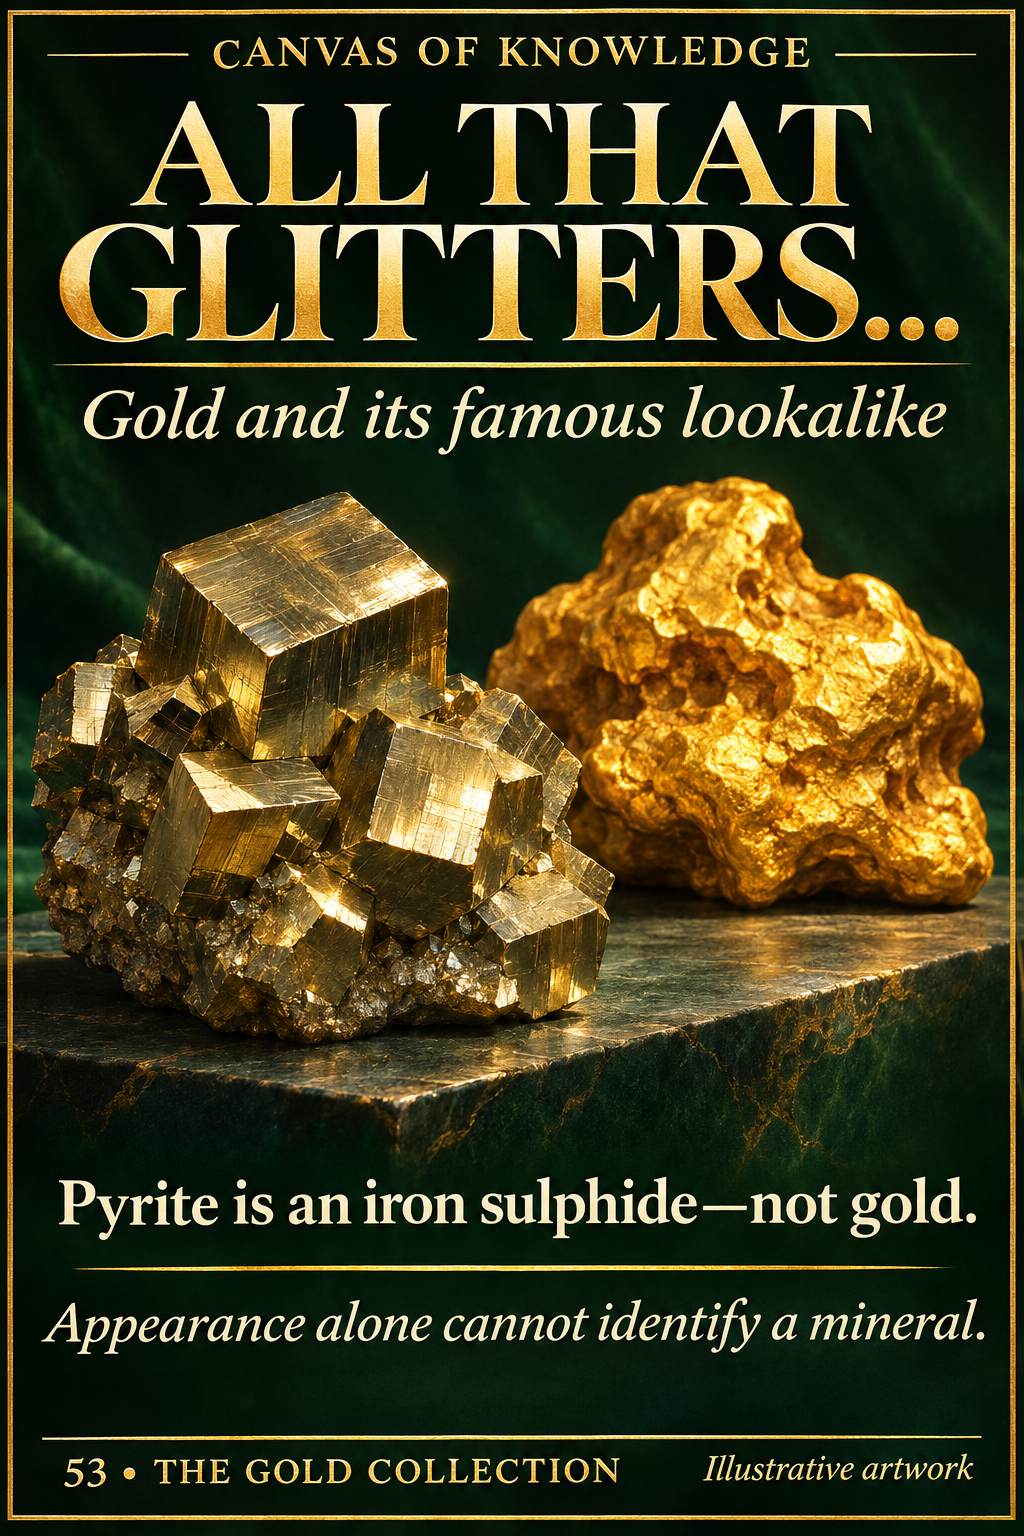
Brassy cubic pyrite crystals sit beside an irregular gold-coloured nugget in a carefully lit mineral display.View full infographic
53 / 60

All that glitters...

Pyrite can catch the eye with a golden metallic shine. Its chemistry and physical properties tell a different story from its resemblance to gold.

Read the infographic & sources

All that glitters... Gold and its famous lookalike. Pyrite is an iron sulphide—not gold. Appearance alone cannot identify a mineral.

Illustrative mineral specimens, not samples authenticated from photographs. The scene is not a guide to destructive home testing.

Clear water moves over a rocky stream bed, with a few gold grains gathered in a sheltered crevice among darker pebbles.View full infographic
54 / 60

Gold carried by water

A river does more than move sediment. Under suitable conditions, erosion, transport and gravity can concentrate gold grains released from their original rock.

Read the infographic & sources

Gold carried by water The story of placer deposits. Weathering frees gold from rock. Moving water can concentrate dense grains.

Illustrative stream scene, not a surveyed deposit or a prospecting map. Grains are enlarged for visibility and do not imply recoverable quantities at any location.

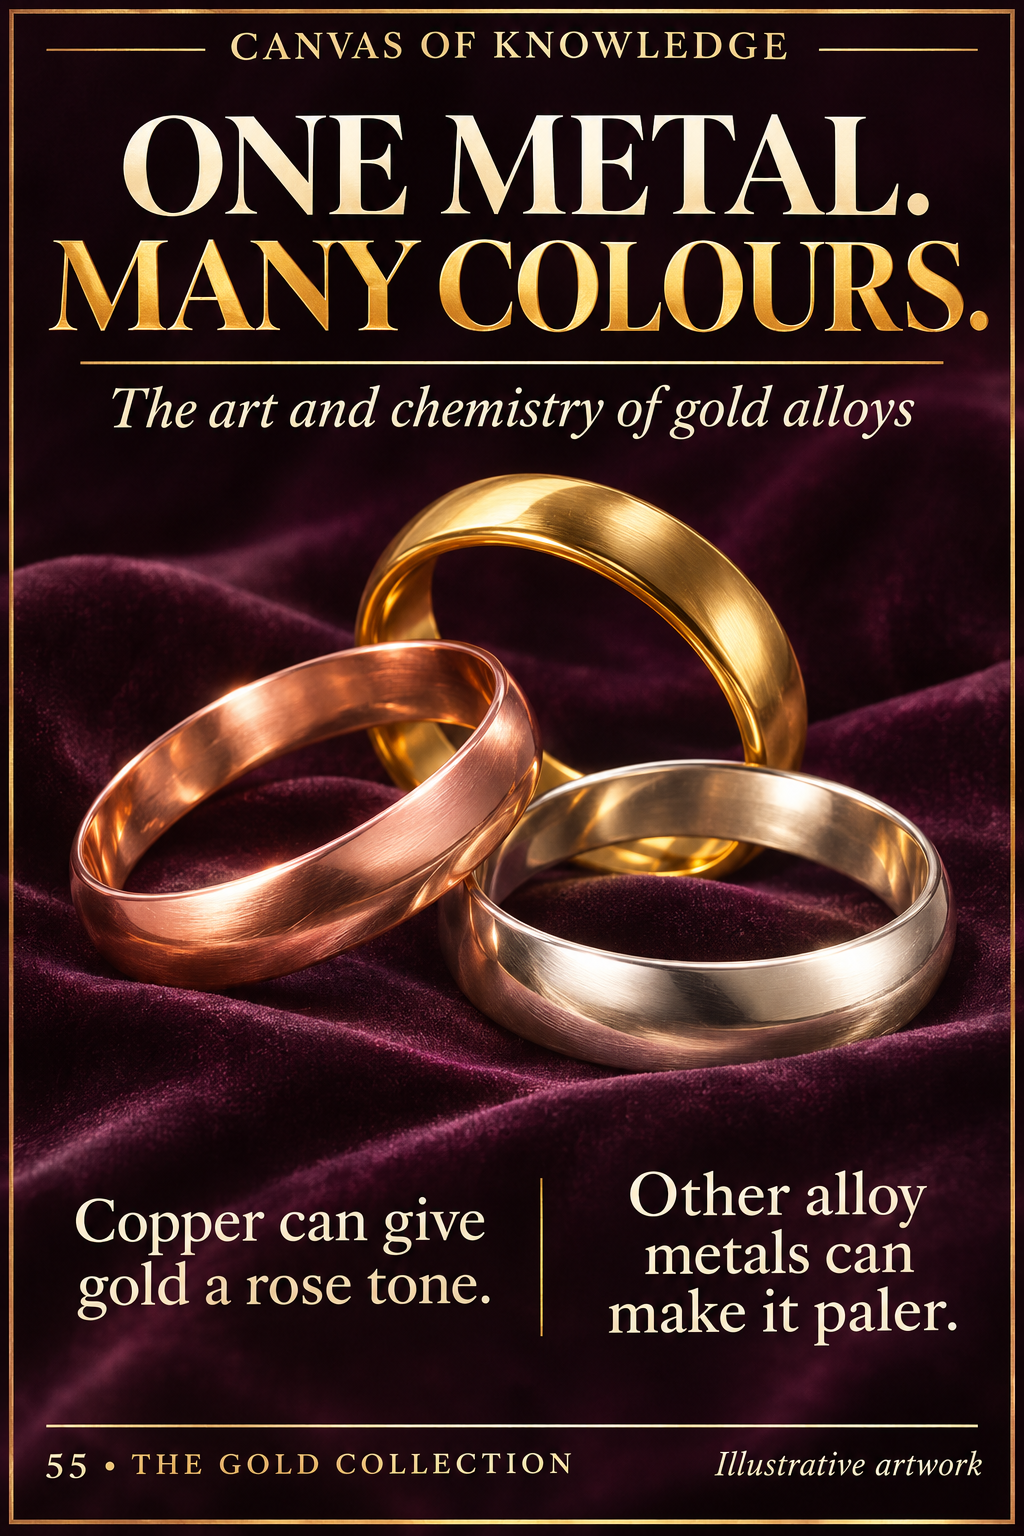
Yellow, rose and white gold-coloured rings lie together on a dark jeweller’s surface under neutral light.View full infographic
55 / 60

One metal. Many colours.

Yellow, rose and white jewellery can all contain gold. Alloying and surface treatments explain why colour is a separate question from gold content.

Read the infographic & sources

One metal. Many colours. The art and chemistry of gold alloys. Copper can give gold a rose tone. Other alloy metals can make it paler.

Illustrative jewellery, not verified alloy samples. Appearance in the picture does not establish purity, composition or the presence of a surface coating.

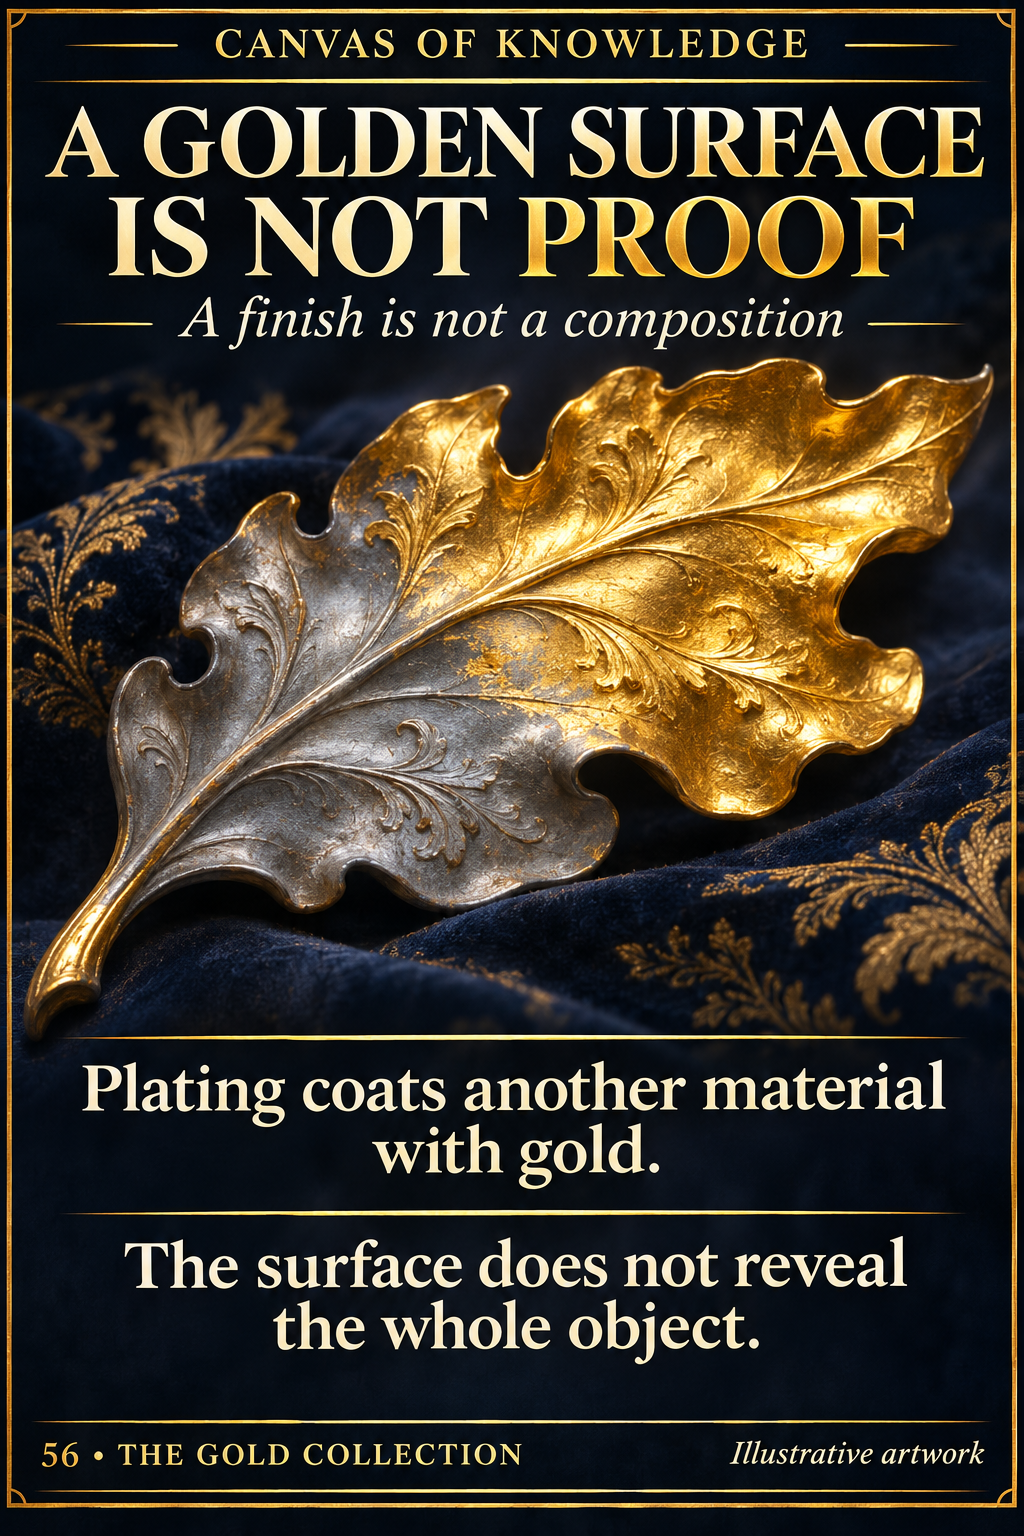
An ornate metal leaf has a gold-coloured surface over one portion and a muted silver-grey surface over another.View full infographic
56 / 60

A golden surface is not proof

Gold plating changes an object’s surface. Understanding the material underneath is essential before treating its appearance as evidence of its gold content.

Read the infographic & sources

A golden surface is not proof A finish is not a composition. Plating coats another material with gold. The surface does not reveal the whole object.

Conceptual illustration, not a test of a particular item. The US and UK terminology examples below apply to those jurisdictions, not universally.
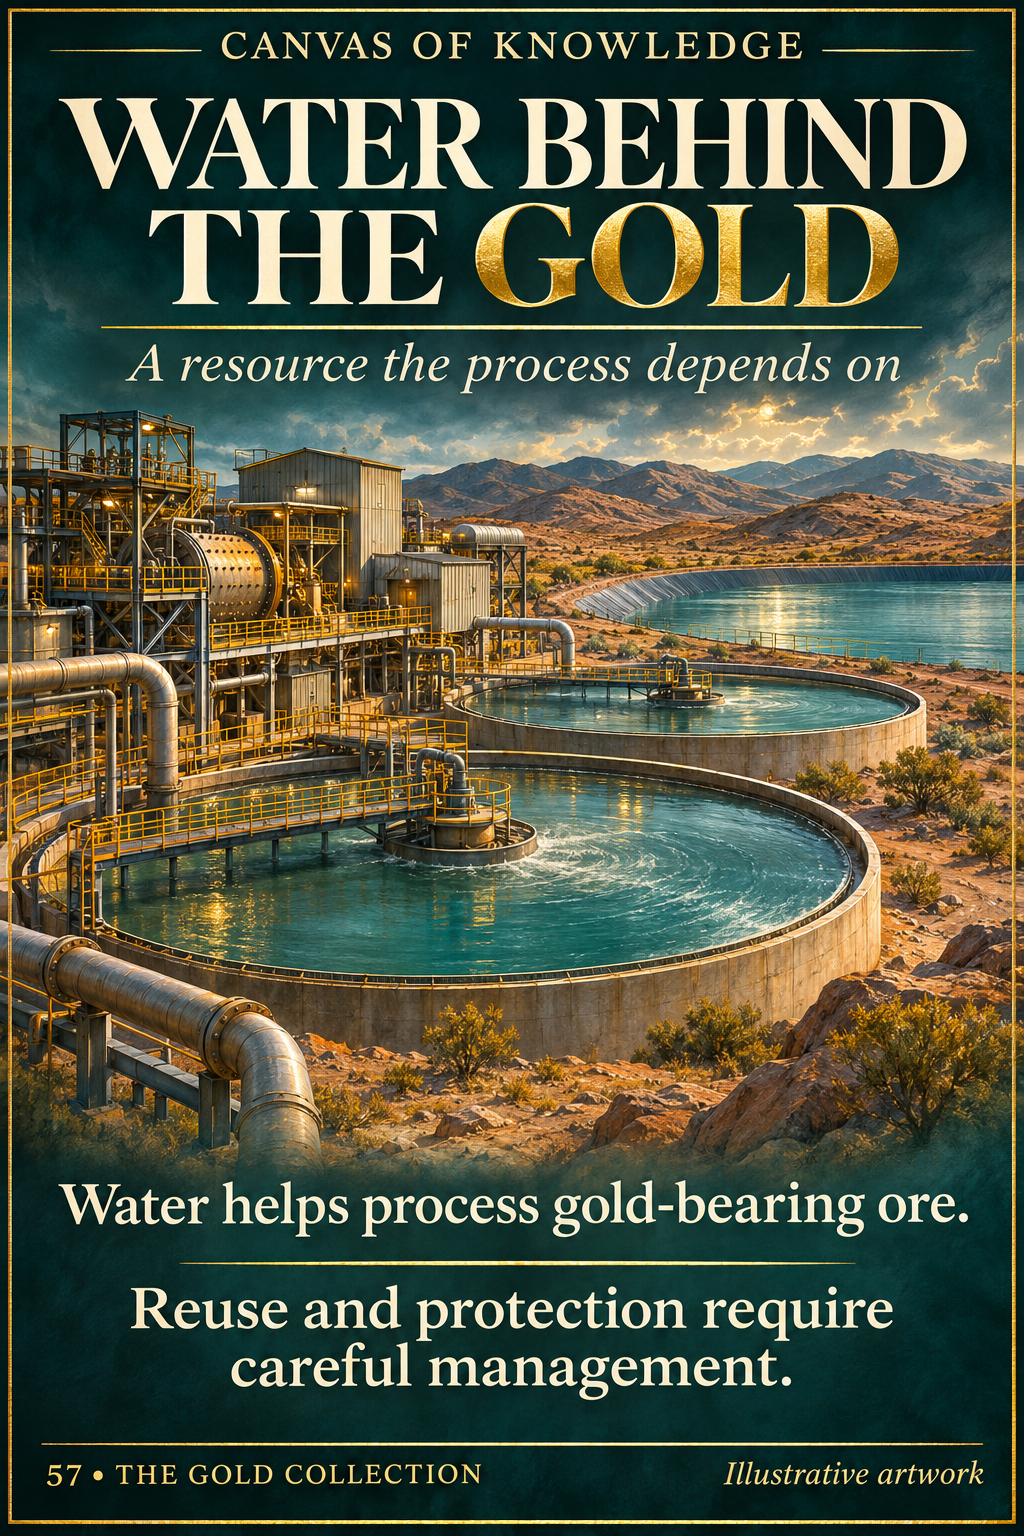
A conceptual mine-processing landscape shows water infrastructure beside gold-bearing rock and processing facilities.View full infographic
57 / 60

Water behind the gold

Gold production depends on water as well as rock and machinery. Its use, reuse and protection have to be understood in the circumstances of each mine.
Read the infographic & sources

Water behind the gold A resource the process depends on. Water helps process gold-bearing ore. Reuse and protection require careful management.

Illustrative landscape, not an engineering plan or a water-use estimate. Requirements and treatment methods vary by mine, process and location.

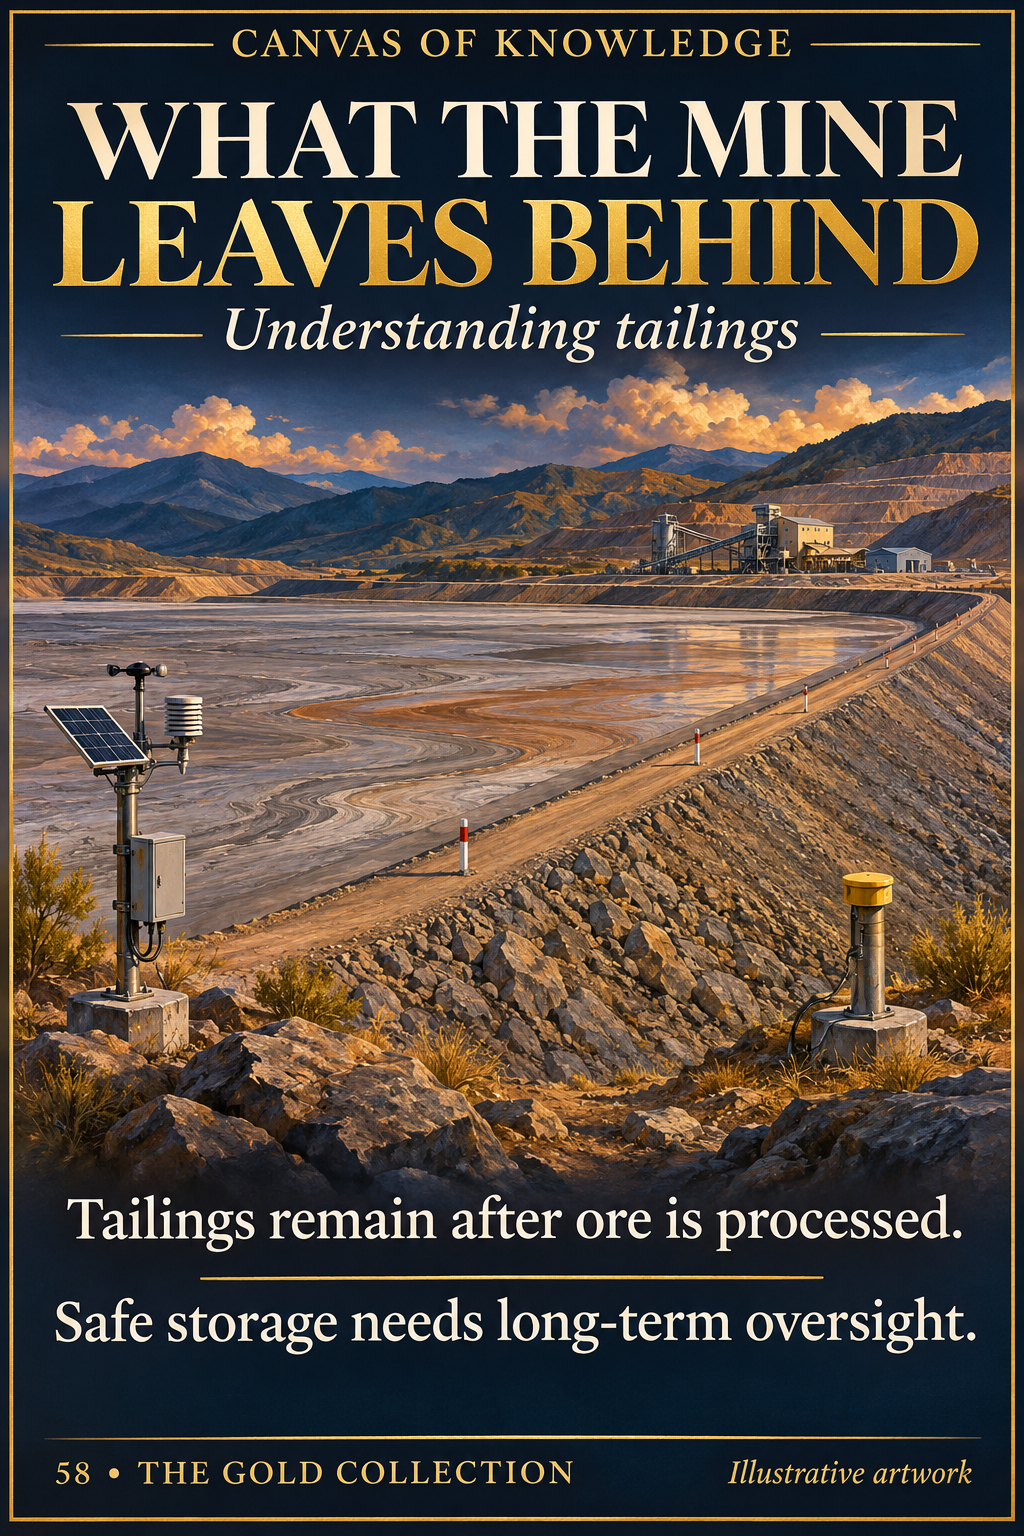
An illustrative mine-tailings facility appears within a broad landscape with containment and monitoring infrastructure.View full infographic
58 / 60

What the mine leaves behind

Recovering gold leaves processed material that must still be managed. Tailings are part of a mine’s long-term responsibilities, including after production ends.

Read the infographic & sources

What the mine leaves behind Understanding tailings. Tailings remain after ore is processed. Safe storage needs long-term oversight.

Conceptual landscape, not a design or a safety assessment of a real facility. Tailings composition, water content and storage methods vary.
An illustrative gold offer and contract sit under close inspection, suggesting scrutiny of promises and written terms.View full infographic
59 / 60

When the promise shines too brightly

Gold’s reputation can be used to sell an unreliable promise. Recognising warning signs means examining the seller, the product and the terms independently.
Read the infographic & sources

When the promise shines too brightly Recognising gold-investment warning signs. Guaranteed returns are a warning sign. Verify the seller. Read the terms.
General consumer education, not an allegation about a particular seller. Regulatory requirements depend on the product, activity and jurisdiction.

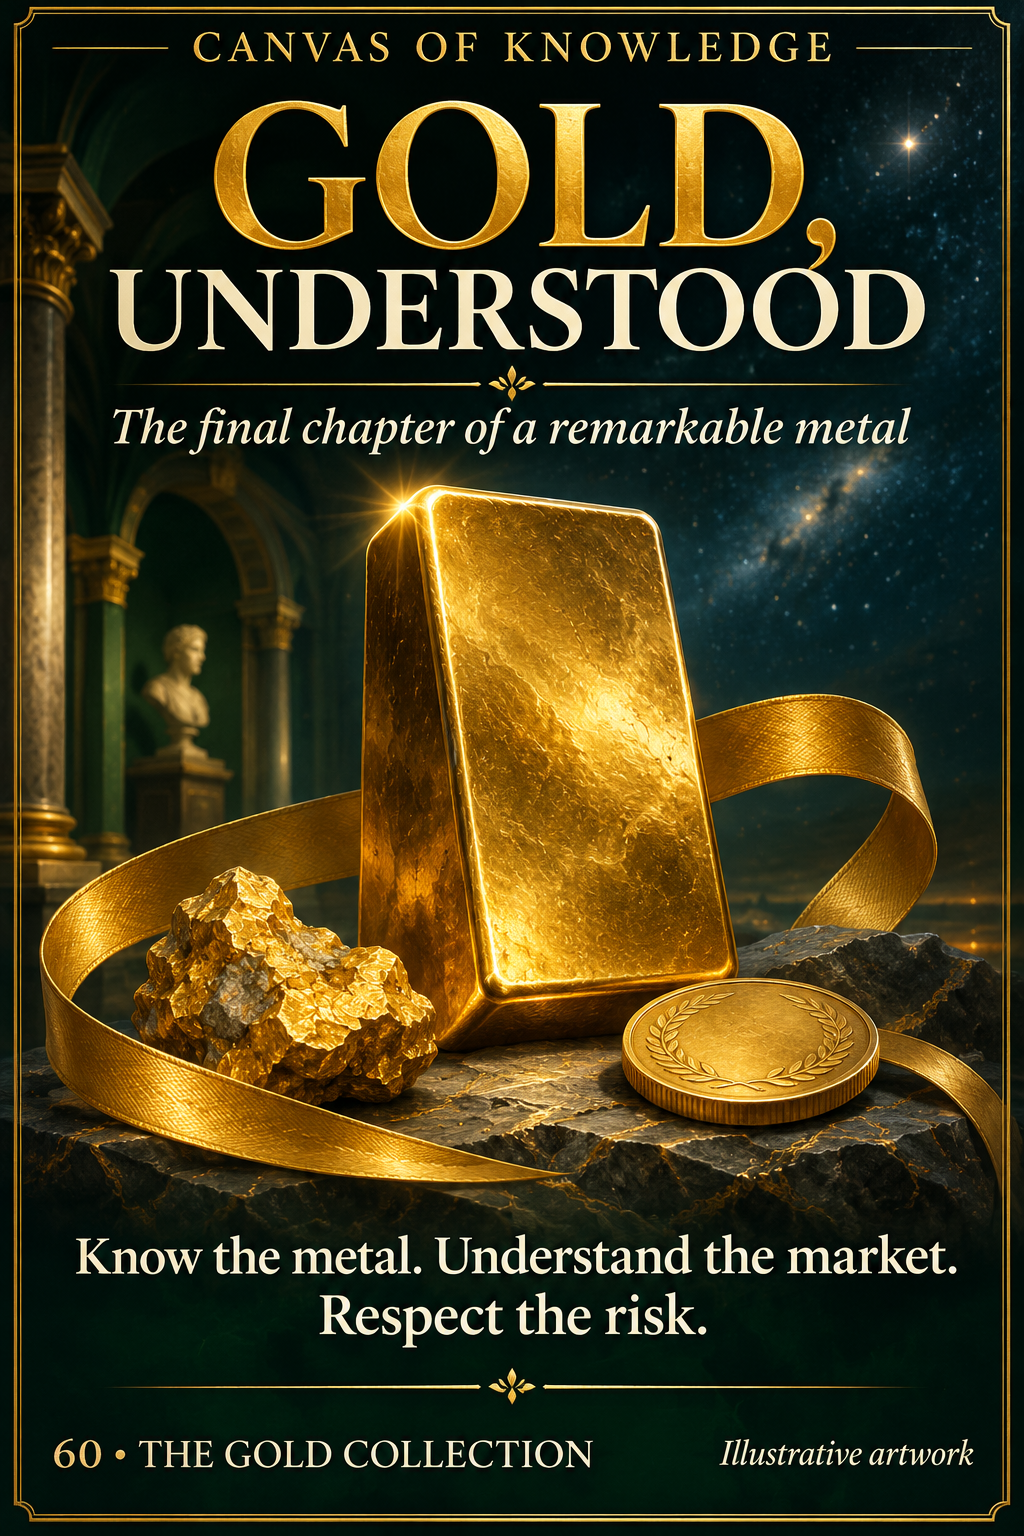
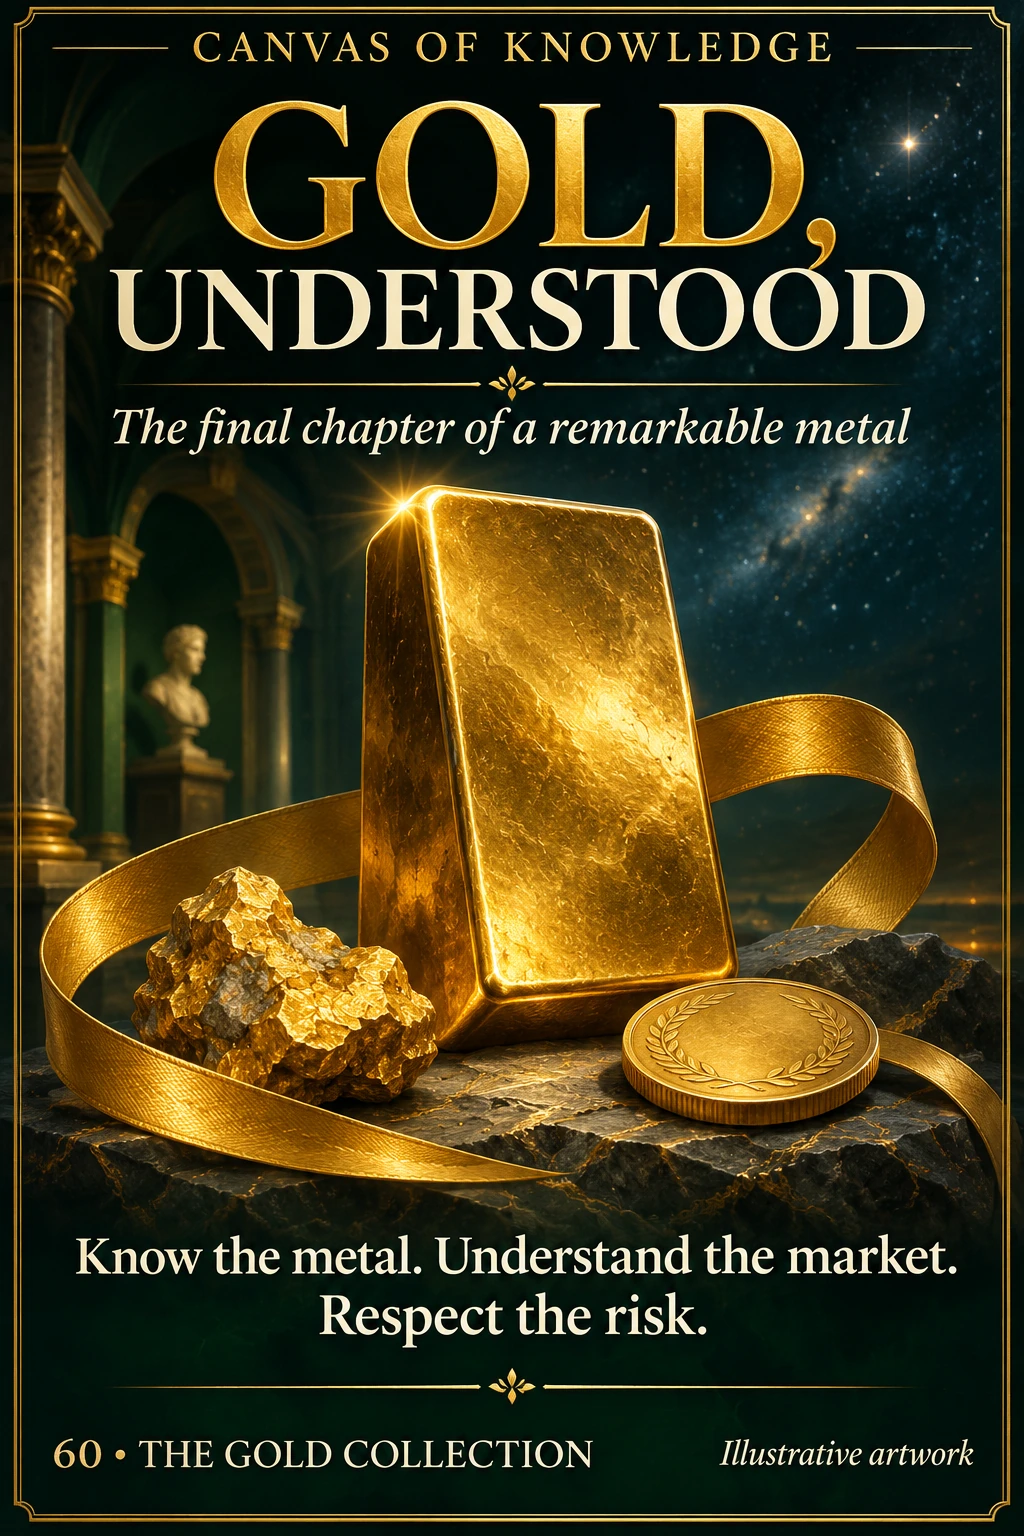
A gold bar, natural nugget and fictional coin sit within a looping gold ribbon against a dark museum-like background.View full infographic
60 / 60

Gold, understood

Sixty posters bring one metal into focus. This closing guide turns the collection into a practical way to read a gold object, a price and a financial promise.

Read the infographic & sources

Gold, understood The final chapter of a remarkable metal. Know the metal. Understand the market. Respect the risk.

Closing synthesis of the sixty-poster collection. The illustration is conceptual; this guide offers a framework for understanding, not a recommendation to buy or trade.

Original artwork · 1,024 × 1,536 px full-resolution downloads · Illustrative scenes; source links and readable text accompany each poster.

The Gold Collection

The Gold Collection

01—04

Understand the metal

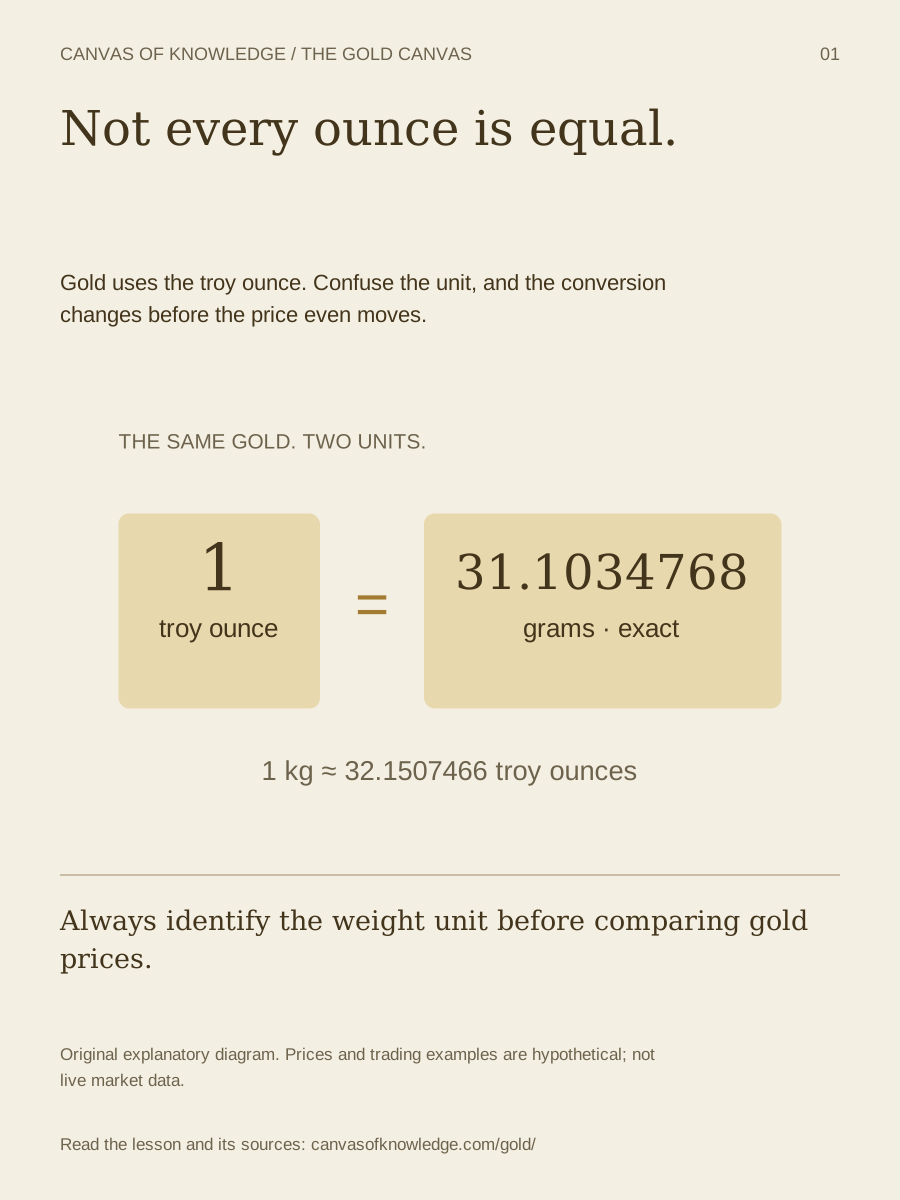
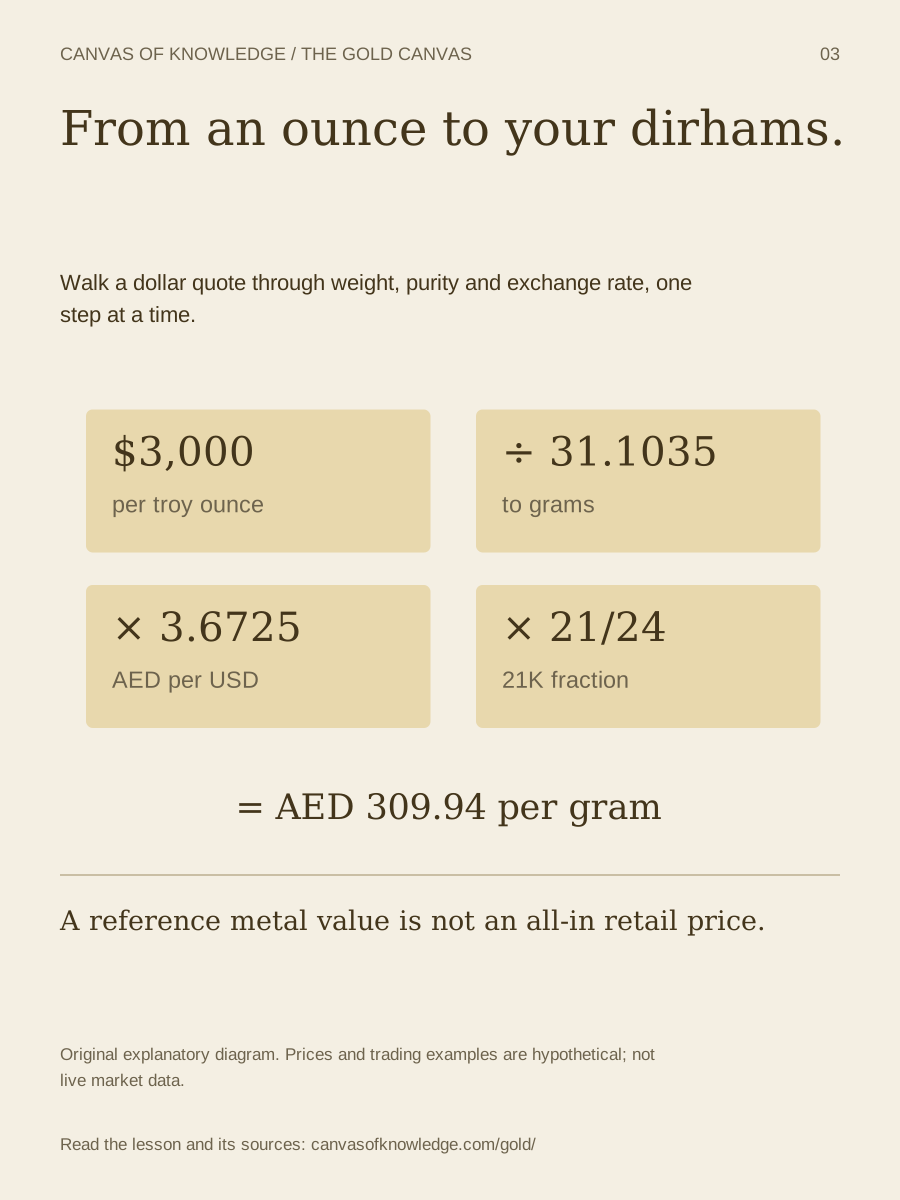
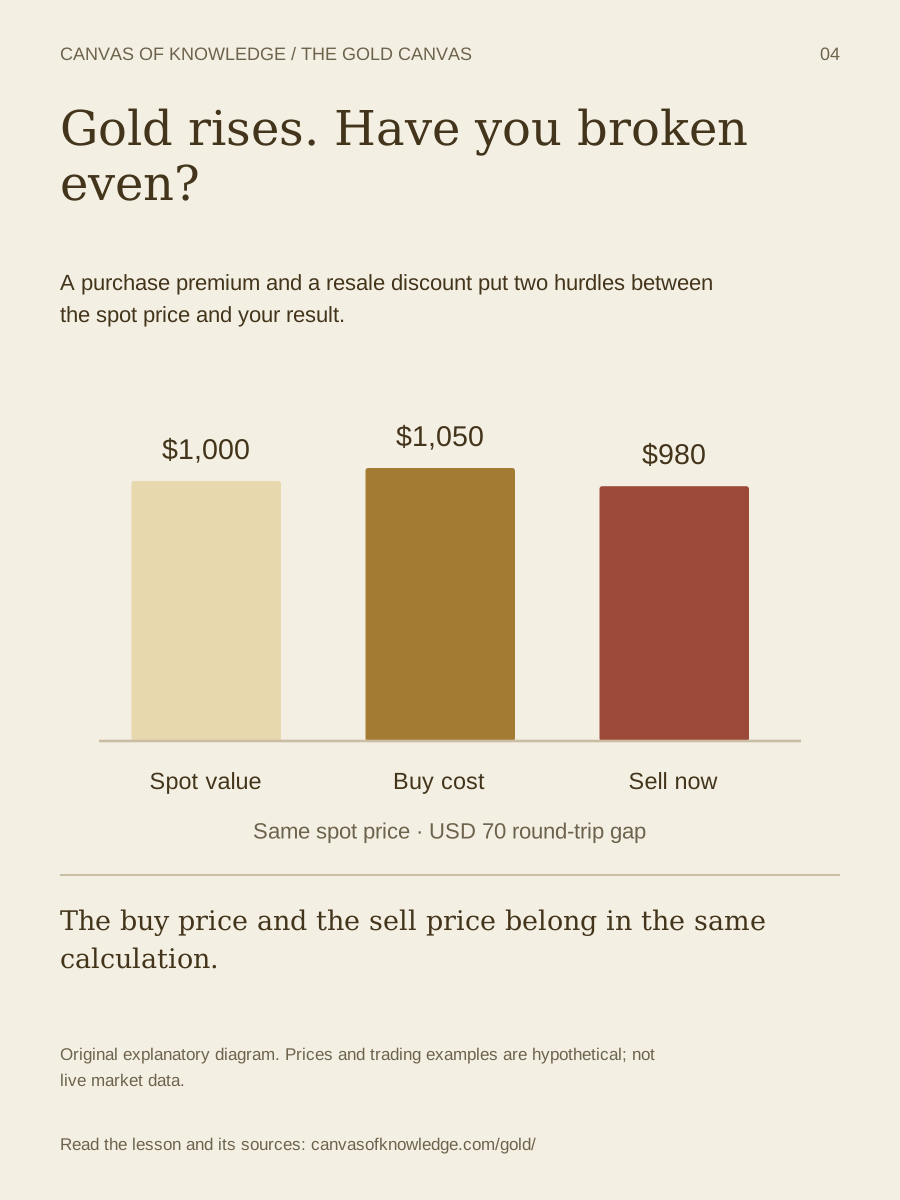
Weight, purity, currency and the real cost of physical gold.

05—10

Understand the trade

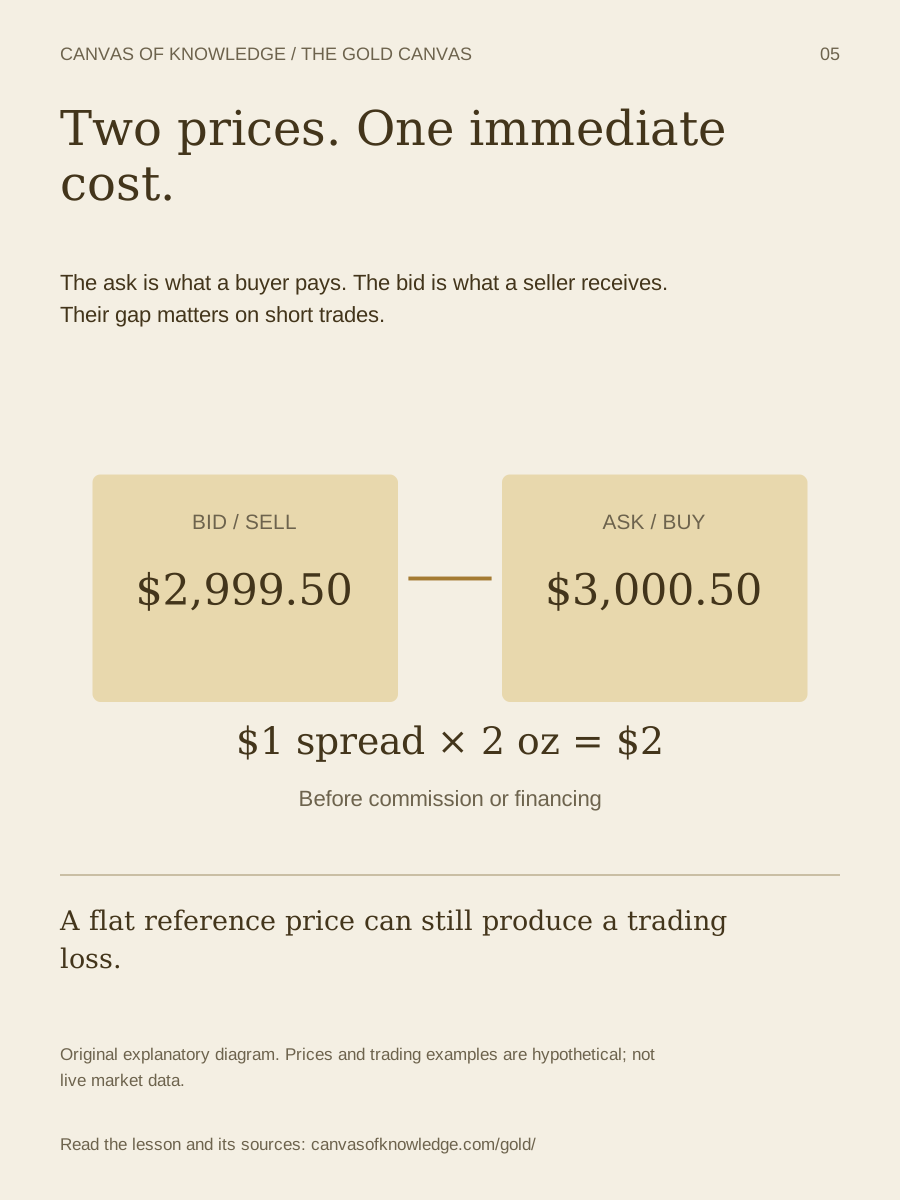
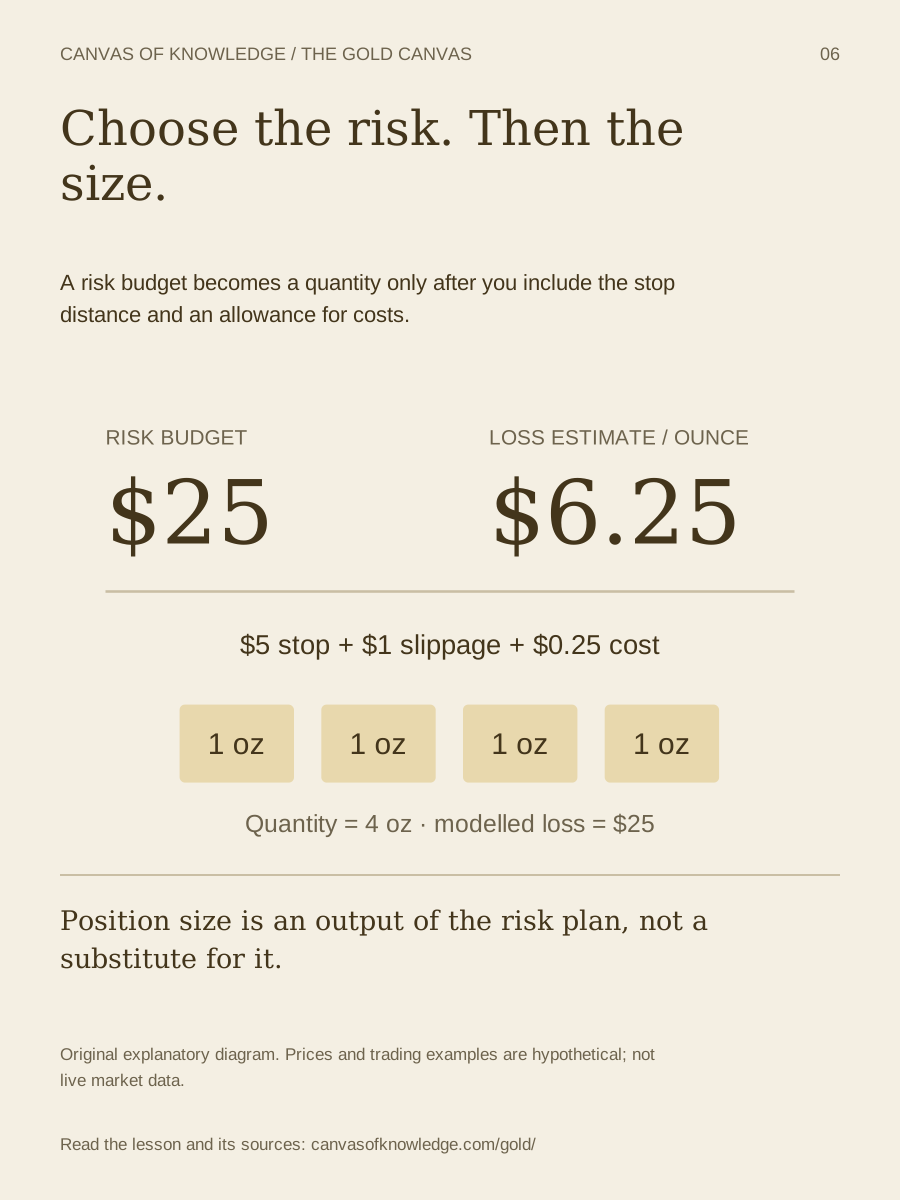
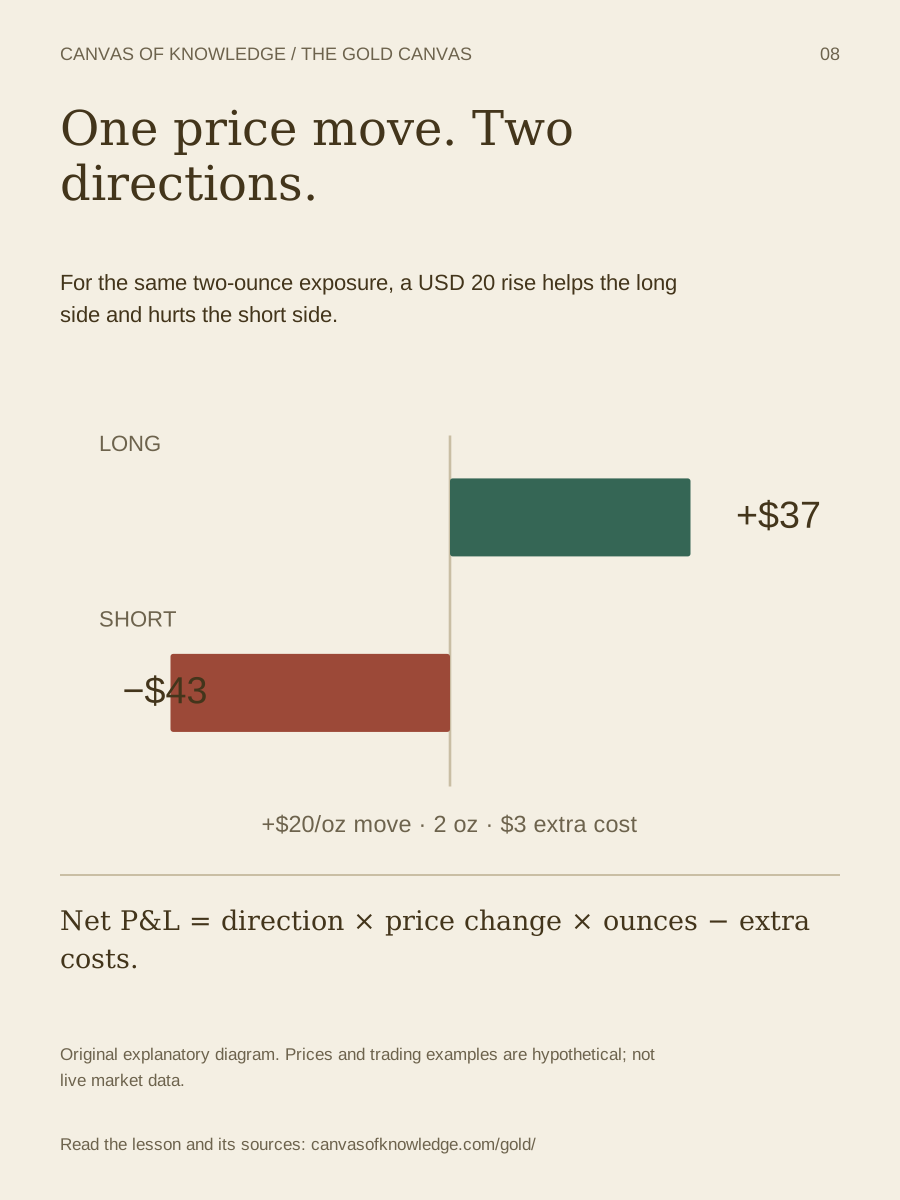
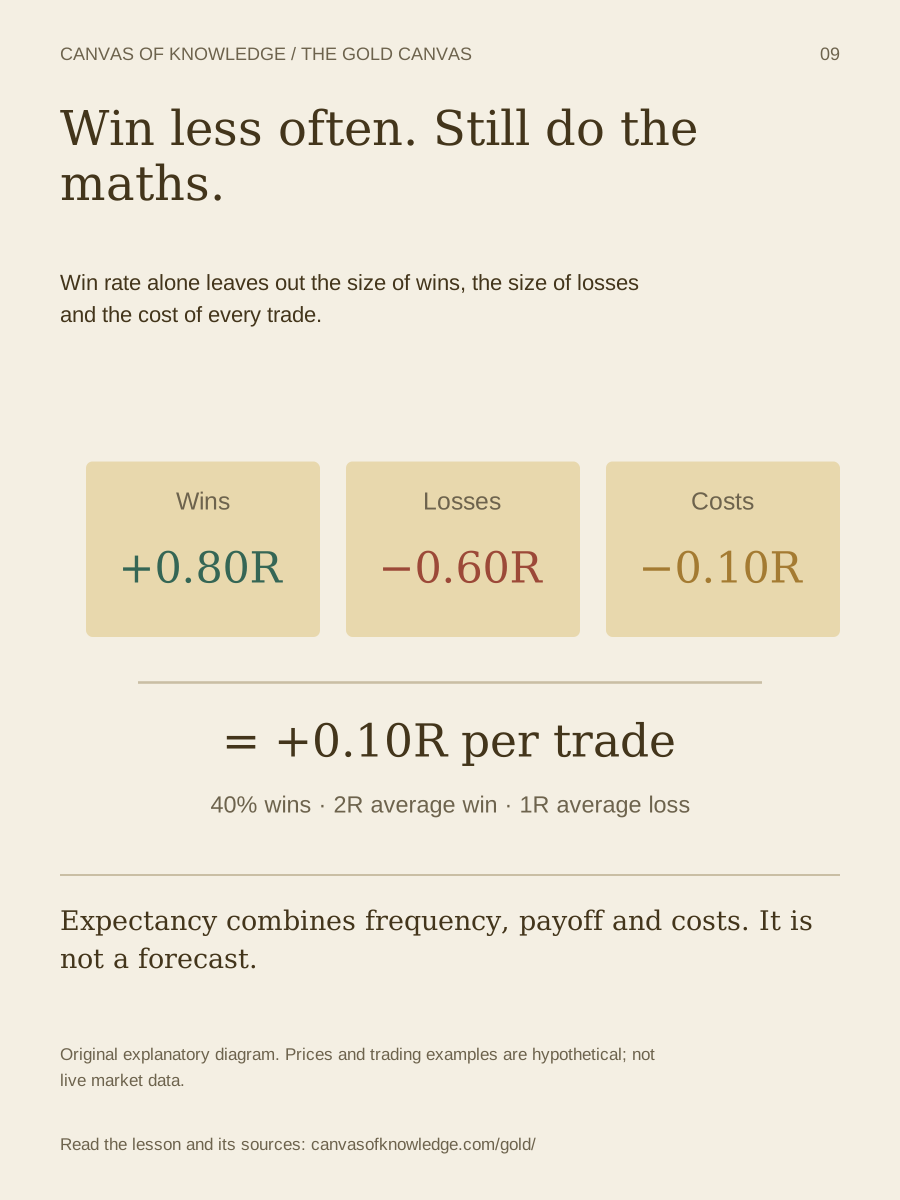
Execution, position size, margin and trading mathematics.

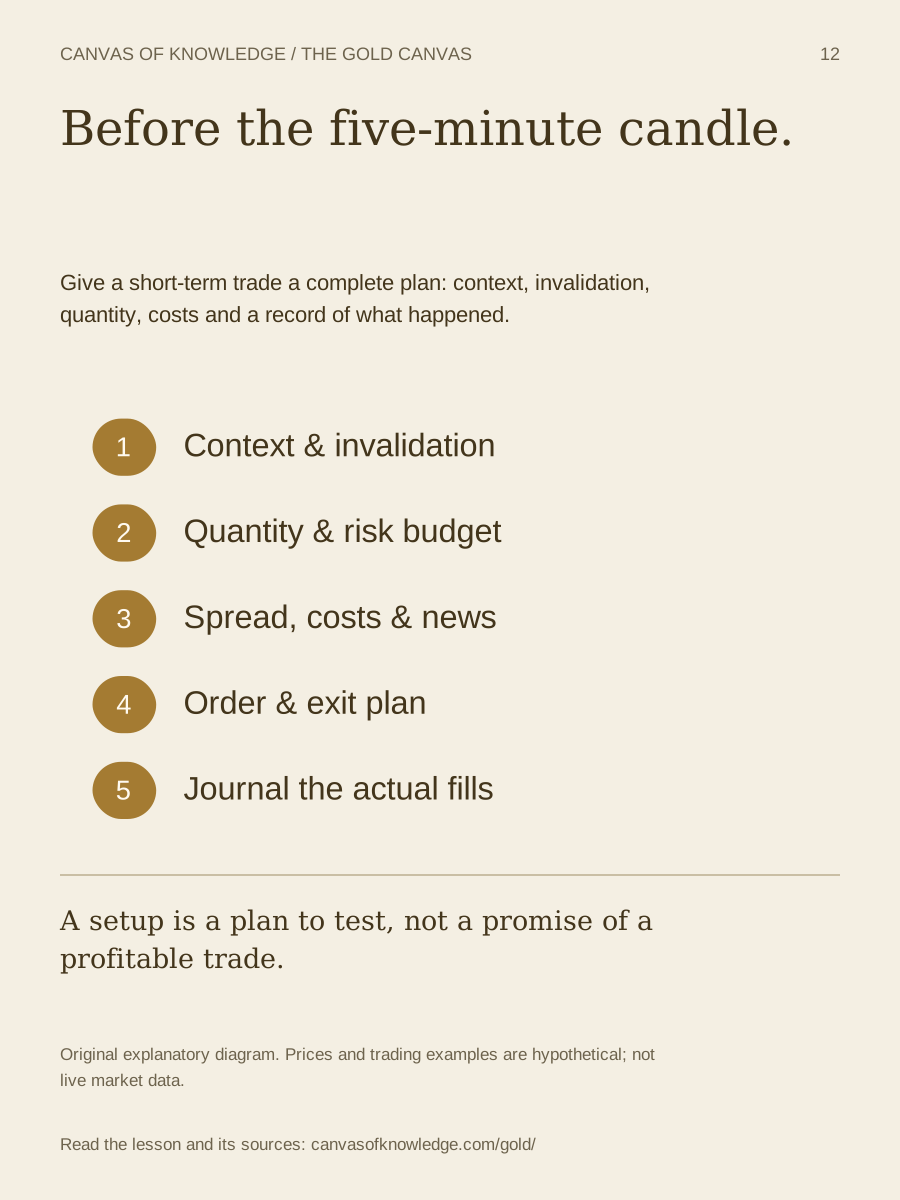
11—12

Build your process

Price drivers, a written plan and a record of the outcome.

THE GOLD ATLASDATA EDITION / 2025 ESTIMATES

THE GEOGRAPHY OF A PRECIOUS METAL

Where the world’s
gold comes from.

China leads. Russia follows. Australia completes the top three.
Explore the countries behind the metal, one tonne at a time.

WORLD MINE PRODUCTION3,300t

USGS estimate for 2025
1 tonne = 1,000 kilograms

01 / CHINA380t11.5% of world estimate
02 / RUSSIA310t9.4% of world estimate
03 / AUSTRALIA280t8.5% of world estimate
TOGETHER, THE TOP THREE29.4%

970 tonnes of the world estimate

Gold mine production map. Highlighted countries are the 13 separately listed by USGS. China is first, Russia second and Australia third. Antarctica omitted.
Named producers Other countries
China outline
RANK 01 / 2025 ESTIMATE

China

380 t11.5% of world estimate

70 tonnes ahead of Russia in this dataset.

Choose a country in the ranking to explore its production. On larger screens, you can also select a highlighted country on the map. Highlighting shows the countries listed separately by USGS; other countries also produce gold. Map boundaries are illustrative.

THE RANKING2025 · estimated mine output

Equal values share a rank. The list covers the 13 countries named separately in the USGS table.

Sources, definitions & rounding

Source: USGS Mineral Commodity Summaries 2026, Gold chapter ↗. Values are estimates of 2025 mine production in metric tonnes of gold content, not ore, refinery output, exports or central-bank holdings.

World shares divide each country’s estimate by the same rounded USGS world total of 3,300 tonnes. The 13 named rows sum to 2,250 tonnes; USGS reports “Other countries” as 1,000 tonnes. These independently rounded values do not sum exactly to the rounded world total. We preserve the source values rather than invent a balancing adjustment.

Outlines: Natural Earth, public domain ↗; Equal Earth projection, Antarctica omitted. Map markers locate countries, not individual mines. Standalone country shapes are individually fitted and are not to a common scale. Data checked 13 November 2026.

Download the source table · CSV ↓
THE GOLD ATLAS / 01

Where the world’s gold comes from

The world map, all 13 named producers, and a ranked comparison in one detailed poster.

4,800 × 7,200 px PNG · Source and year included
THE GOLD ATLAS / 02

Three countries. 970 tonnes.

A closer look at China, Russia and Australia, with country silhouettes and a common production scale.

4,800 × 6,400 px PNG · Source and year included

Gold production infographic

SIX WAYS TO TEST AN IDEA

Change a number.
See what changes.

Educational models. Hypothetical inputs.
No live prices or trading signals.

THE GOLD LAB / INTERACTIVE

Metal value in AED

Convert a USD quote into a theoretical metal value.

—

Uses ideal karat fractions. Excludes making charges, premiums, tax, shipping and resale costs. Inputs are illustrative, not live.

See the calculation & input limits

spot ÷ 31.1034768 × FX × grams × karats ÷ 24

Gold price · USD / troy oz: 0.01–1,000,000; Exchange rate · AED / USD: 0.0001–1,000; Metal weight · grams: 0–1,000,000; Purity · karats: 1–24.

PART ONE / THE METAL

Start with what you own.

4 illustrated lessons
PART TWO / THE TRADE

Make every ounce count.

6 illustrated lessons
PART THREE / THE PROCESS

A framework before a forecast.

2 illustrated lessons
YOUR COLLECTION

Keep your curiosity.

Saved on this browser. Pick up where your curiosity left off.