
The world
we make.
Where people live is only the beginning. Explore how populations, cities, movement and culture shape the places we call home.
THE QUESTION BEHIND THE MAP
Not just where.
Why there? Who benefits?
What changes?
Physical geography explains the terrain. Human geography examines the relationships between society and space: settlement, livelihoods, mobility, identity and power.
There is no single national average that can tell the whole story. Start with a place. Change the scale. Follow the connections.
Ten ways to read a place.
Each chapter pairs an original vector infographic with a deeper explanation and links to primary sources.
 01
Population is a balance, not a destiny.
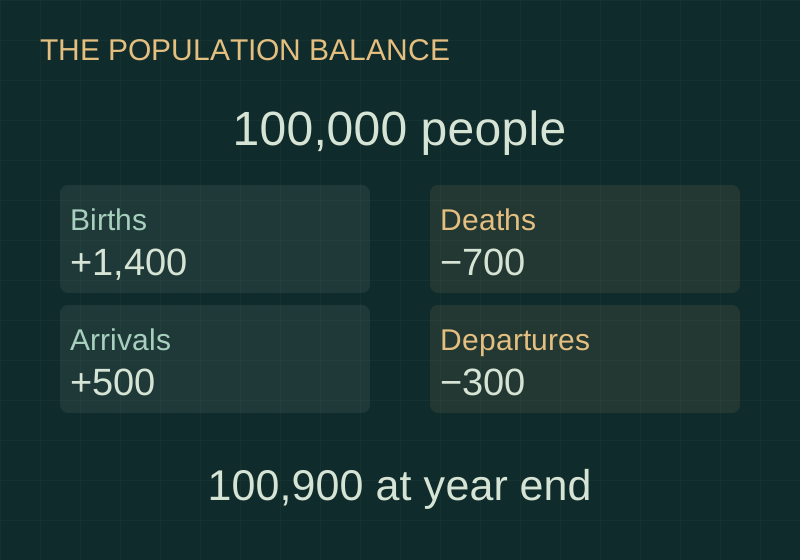
A country’s population is counted at a moment. Births, deaths and migration happen over an interval. Separating the snapshot from the movements explains how a population can grow, shrink or remain almost unchanged while millions of lives change around it.
Read the chapter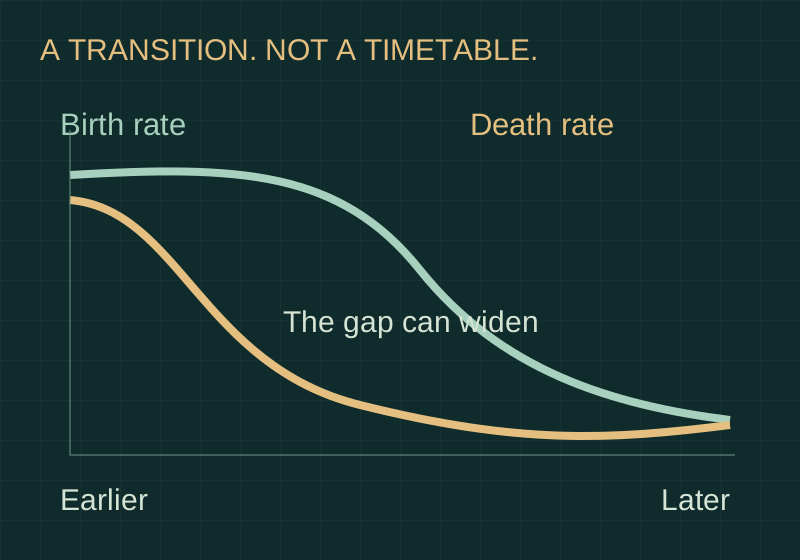 02
Different paths through demographic change.
Demographic transition describes a broad shift in mortality and fertility. Its sequence helps explain changing age structures, but a neat diagram cannot predict a country’s timetable. Institutions, health, rights, migration and the inherited population structure change the actual journey.
Read the chapter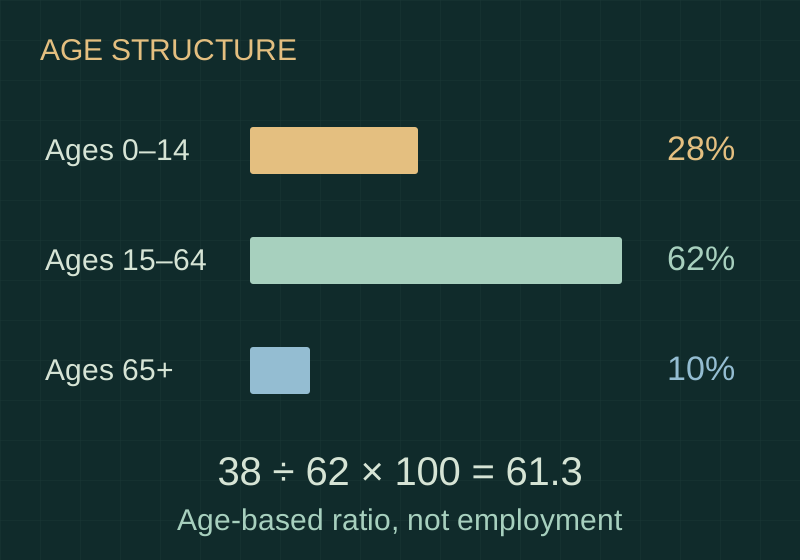 03
The shape of a population matters.
Two countries can contain the same number of people but face different needs for classrooms, employment, housing and care. Age structure reveals this composition. A dependency ratio condenses it into one number, while leaving actual work and support relationships unresolved.
Read the chapter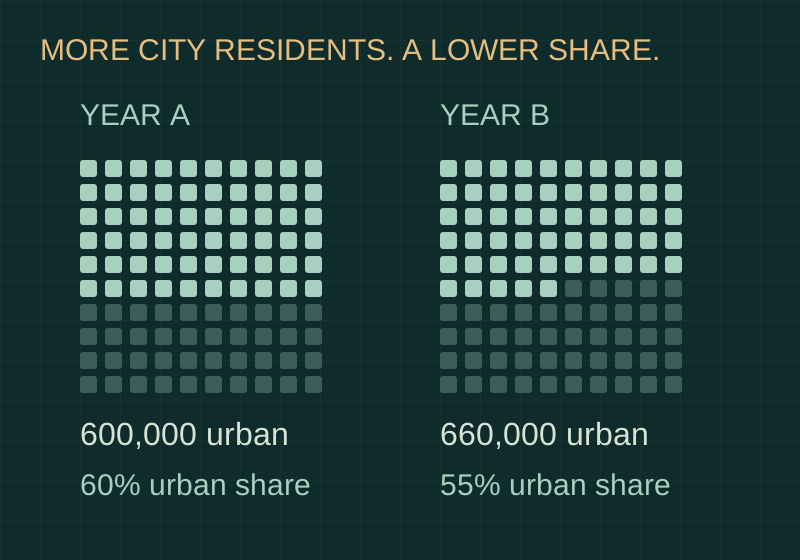 04
A growing city. A changing share?
Urban growth describes a change in urban population. Urbanisation describes a rising urban share of the total. These can move differently. Definitions matter too: a municipality, a continuous built-up area and a wider commuting region describe different pieces of the city.
Read the chapter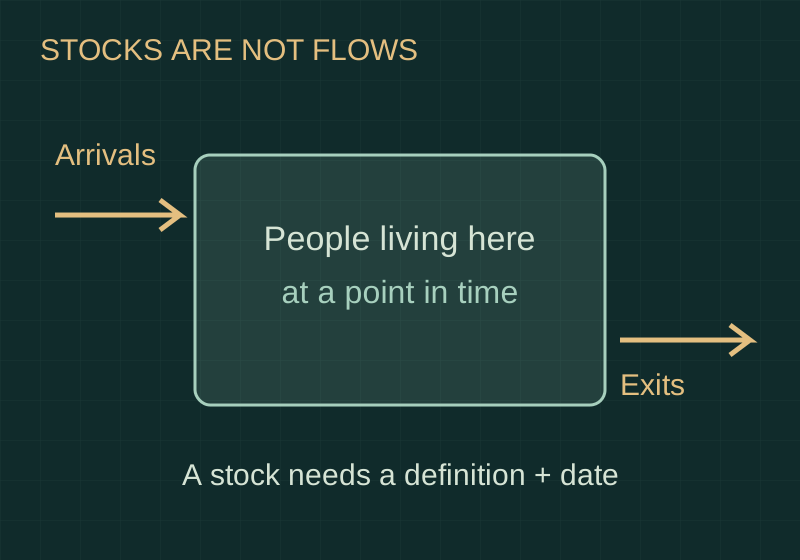 05
People move. The measures differ.
A map of people living outside their birth country is a snapshot accumulated over many years. A map of arrivals during one year records movement. Neither alone explains motives, legal protection, return journeys or the experience of people displaced within borders.
Read the chapter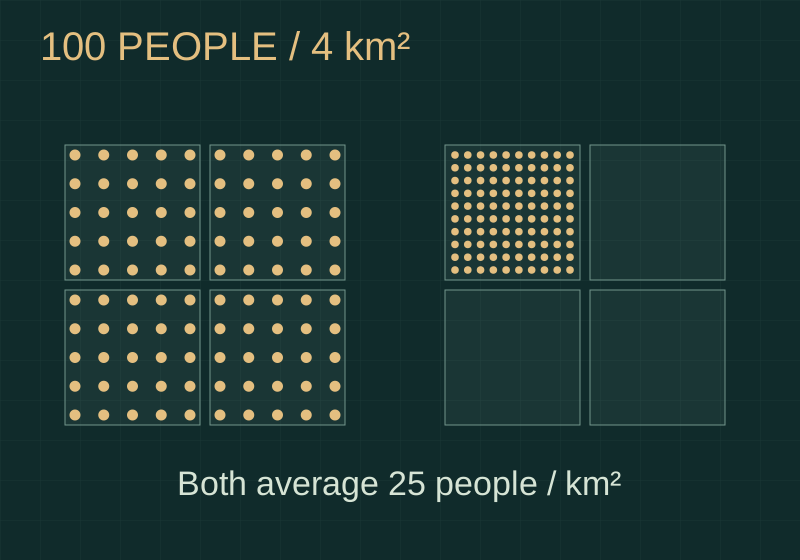 06
Same density. Different lived worlds.
A national average can hide concentrated cities, almost empty hinterlands and sharp differences between neighbouring districts. Human geography asks where people are, at what scale they are counted and which boundary turns their distribution into a single number.
Read the chapter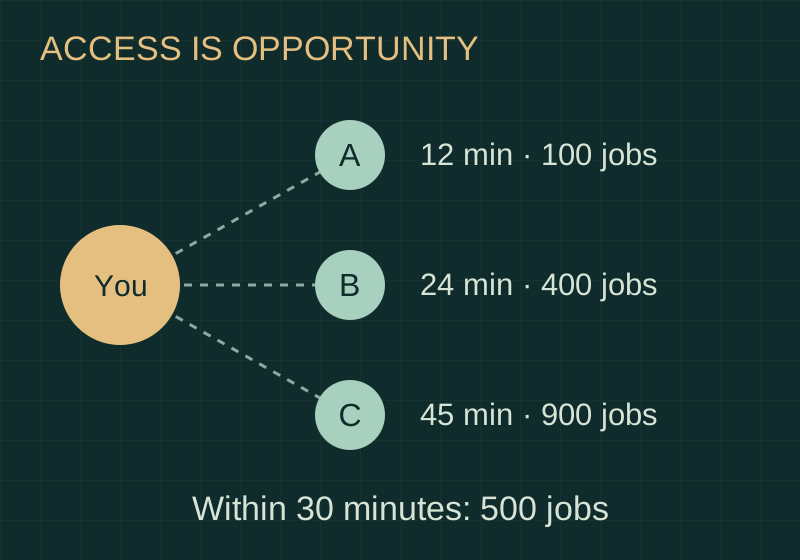 07
Near is not always accessible.
A workplace five kilometres away can be harder to reach than one twenty kilometres away. Accessibility describes the opportunities a person can actually reach, shaped by transport, time, cost, opening hours and the arrangement of places.
Read the chapter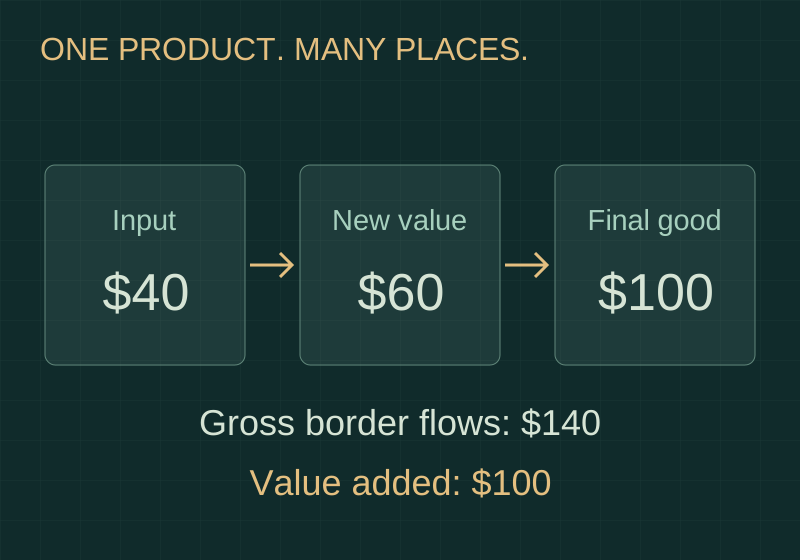 08
One product. Many places.
The country named on a product’s final assembly label may explain only one stage of its journey. Design, materials, components, logistics and services can connect different places, with different contributions and different shares of value.
Read the chapter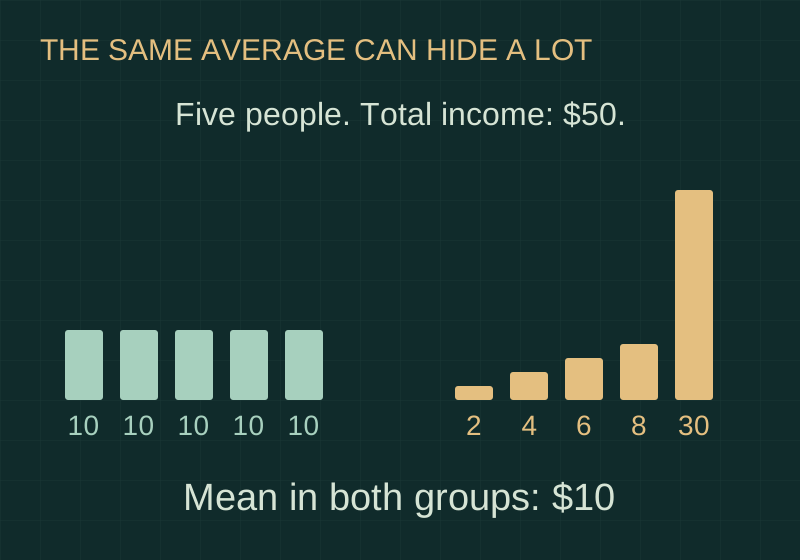 09
An average can hide a world.
A prosperous national average does not describe how prosperity is shared. Human geography looks beneath aggregate figures to households, neighbourhoods and regions—and asks whether the measure describes income, consumption, production or wealth.
Read the chapter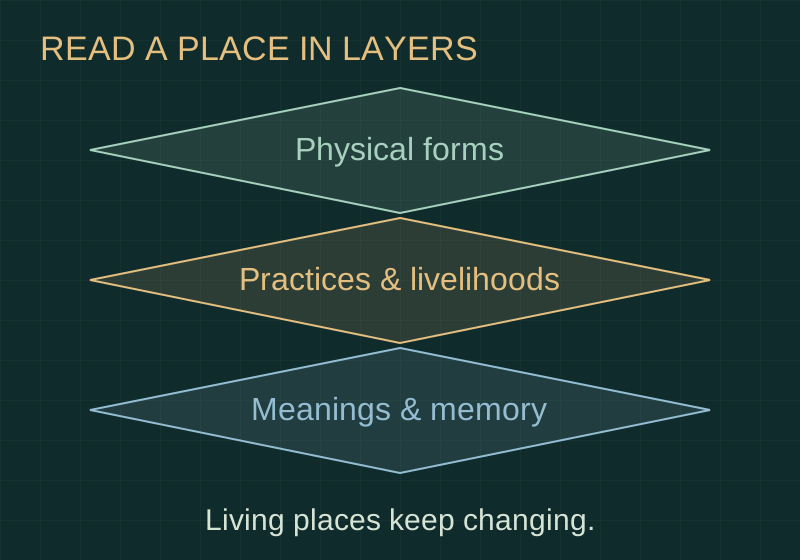 10
A landscape is more than land.
Terraces, street names, market routes and places of worship carry more than a physical form. They can reveal work, memory, knowledge and identity—while their meanings differ between people and change through time.
Read the chapterChange an assumption.
Watch the meaning change.
Three transparent models. Every number below is hypothetical, so you can explore the mechanics without mistaking an illustration for a forecast.
Four flows.
One population.
Start with 100,000 residents. Change births, deaths, arrivals and departures to see what contributes to the change.
+900 residents · +0.9% over the year
Read the model
Closing population = opening population + births − deaths + arrivals − departures. This one-year accounting illustration assumes consistent boundaries and residence definitions, and no statistical adjustment. It does not model age structure, future behaviour or subsequent years.
A journey is more
than a distance.
Count jobs reachable within a time budget. The model changes travel times; it does not move the destinations or create new jobs.
Destinations: A has 100 jobs, B has 400, and C has 900. All are hypothetical. A reachable job is not necessarily a vacancy or a suitable job.
2 of 3 destinations reachable
Read the model
Baseline travel times are A: 12, B: 24 and C: 45 minutes. The illustrated improved network uses A: 12, B: 24 and C: 28 minutes. A destination counts when its time is at or below the selected budget. This cumulative-opportunity measure omits fares, reliability, disability access, competition, skills and service capacity.
Age categories
are not job categories.
Adjust the shares of children and older residents. The working-age share is the remainder. The total always stays at 100%.
An age-based dependency ratio does not count actual earners or people needing care. Employment, education, health and institutions change its meaning.
People aged 0–14 or 65+ per 100 people aged 15–64
Read the model
Ratio = (share aged 0–14 + share aged 65+) ÷ share aged 15–64 × 100. The ranges ensure a positive denominator. The model groups all people into three age bands; it is not a measure of actual household dependency or a prediction of a demographic dividend.
Now choose a country.
Use the Country Atlas to compare dated population, urbanisation and economic indicators across 195 profiles. Bring the concepts; question the averages.
A note on evidence.
The diagrams and lab values are illustrative, not reports of a particular country. Definitions and arguments draw on the UN, World Bank, OECD, UNESCO and other sources linked in each chapter. Sources checked 14 November 2026. People and cultures are diverse and changing; no diagram should be read as a ranking of their worth.