
A ratio is not a settlement pattern
Population density divides a population by an area. The World Bank indicator uses land area, so its denominator differs from measures that include inland water. A ratio is useful for comparison, but it does not tell you whether residents are spread evenly, clustered along a river or concentrated in a few urban neighbourhoods. Nor does it directly measure crowding inside homes, the capacity of public services or the availability of usable land.
Change the boundary, change the result
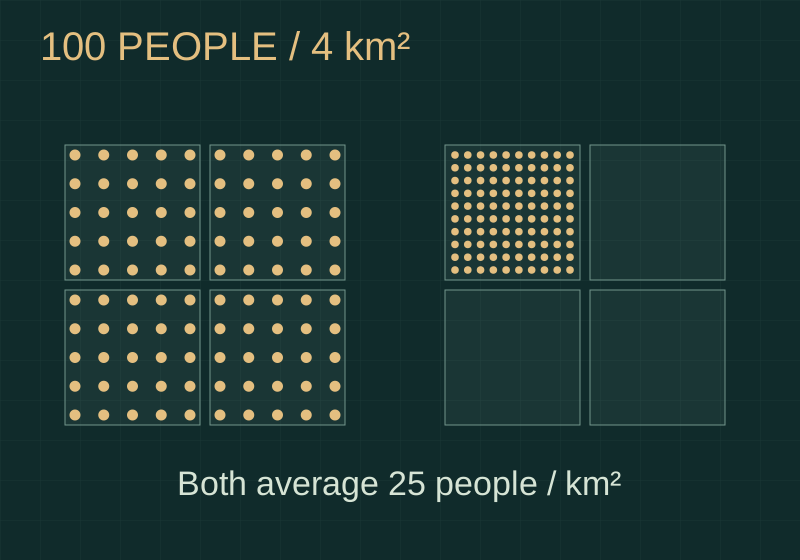
Consider two hypothetical regions, each with 100 residents and four square kilometres of land. Both average 25 residents per square kilometre. In one, each square-kilometre cell contains 25 people. In the other, a single cell contains all 100. Their regional averages are identical; their local settlement patterns are not. Change the boundary around that occupied cell and its measured density becomes 100, without anybody moving. The geographic unit is part of the result.
The city is not always the municipality
City comparisons therefore need an explicit definition. Administrative boundaries can stop at a municipal border, while an economically connected city can extend much farther. OECD functional urban areas combine a city with its surrounding commuting zone, using density and travel-to-work relationships. Read a density map alongside its boundaries, observation year and population definition. Then ask what a finer map reveals, rather than treating a national figure as a description of every resident’s surroundings.