
Look behind the mean
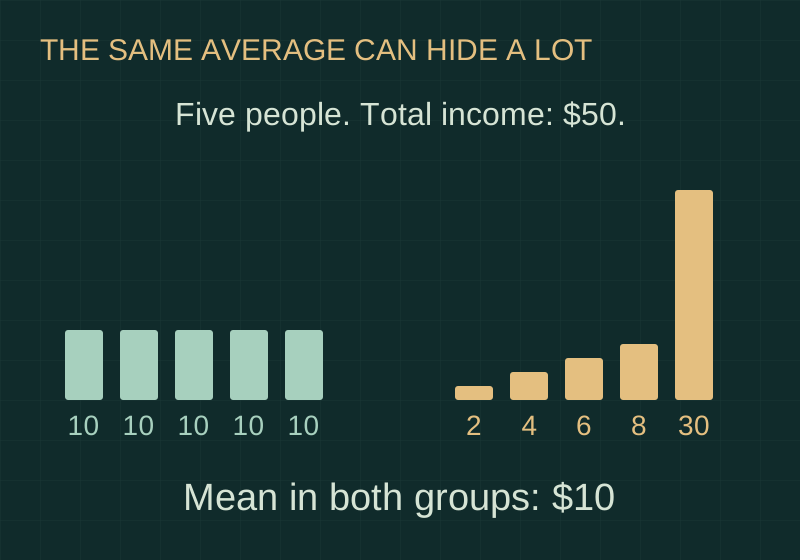
An average compresses a distribution. In a hypothetical group of five people with incomes of $2, $4, $6, $8 and $30 for the same period, total income is $50 and mean income is $10. Nobody receives the mean. The median, the middle observation, is $6; the highest-income person receives 60% of the total. A second group receiving $10 each has the same total and mean, but a different distribution. These are arithmetic examples, not evidence about any real country.
Read the distribution
A Lorenz curve makes that distribution visible by ordering people from the lowest to the highest income and plotting cumulative population against cumulative income. The Gini index summarises its departure from equality. On the 0–100 scale, our equal group has a Gini of 0 and the unequal group 48. One number still cannot show every feature of a distribution: different patterns can produce the same Gini. Inequality is also distinct from poverty, which concerns resources relative to a specified threshold.
Compare like with like
Comparisons need consistent concepts and survey coverage. An income-based series is not interchangeable with consumption expenditure, and GDP per person is a measure of production per resident rather than the income of a typical household. Geographic averages add another layer: an affluent region can contain substantial disadvantage, while residents within the same city can face very different opportunities. Read the mean, median, distribution and place together. None alone tells the full story of living standards or access to essential services.