
Read the gap between two rates
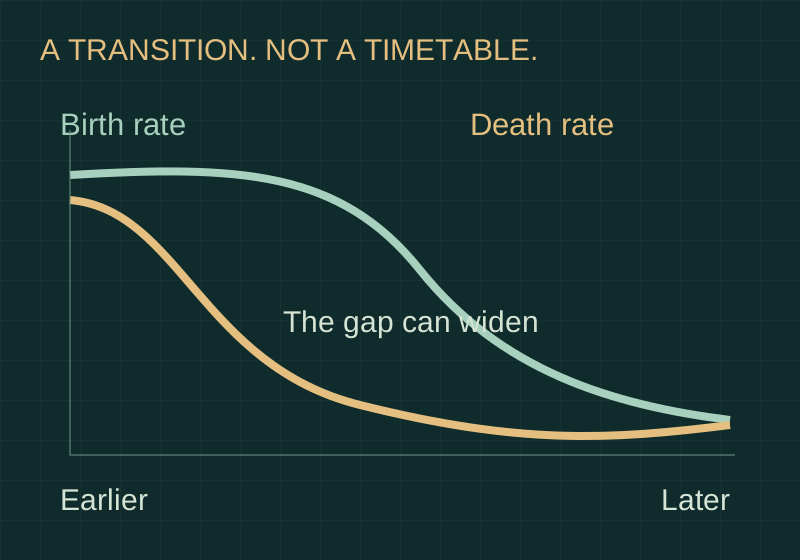
A familiar transition diagram shows death rates falling before birth rates, temporarily widening the gap between them. As birth rates also fall, natural increase can slow. The curves are a conceptual summary of demographic change, not a universal schedule. Crude rates are expressed per 1,000 people and are influenced by age structure: a comparatively old population can have a higher crude death rate even when survival at each age is better.
Population momentum carries the past forward
A fall in births per woman does not instantly stop population growth. When large generations enter reproductive ages, total births can remain substantial despite smaller average families. This inherited influence of age structure is population momentum. Migration and further changes in survival also alter the result. Consequently, a fertility indicator and a population-growth indicator answer different questions, and a single annual observation cannot establish a permanent trajectory.
An opportunity is not an automatic dividend
A growing share of adults in conventional working ages can create an opportunity for economic development. Realising it depends on health, education, decent employment, gender equality and the ability to make reproductive choices. Age structure alone neither creates productive jobs nor guarantees higher living standards. Treat the transition as a framework for planning services and respecting people’s choices, rather than a ranking of societies from backward to advanced.