
Look beyond the total
A population pyramid groups people by age and usually sex. Its outline reflects the accumulated effects of births, survival and migration. A broad base, a bulge in adult ages or a substantial older population can point to different planning priorities. The graph is a snapshot: to interpret a bulge, follow the cohort through time and examine the events and measurement choices behind it, rather than assigning a cause from shape alone.
Understand the denominator
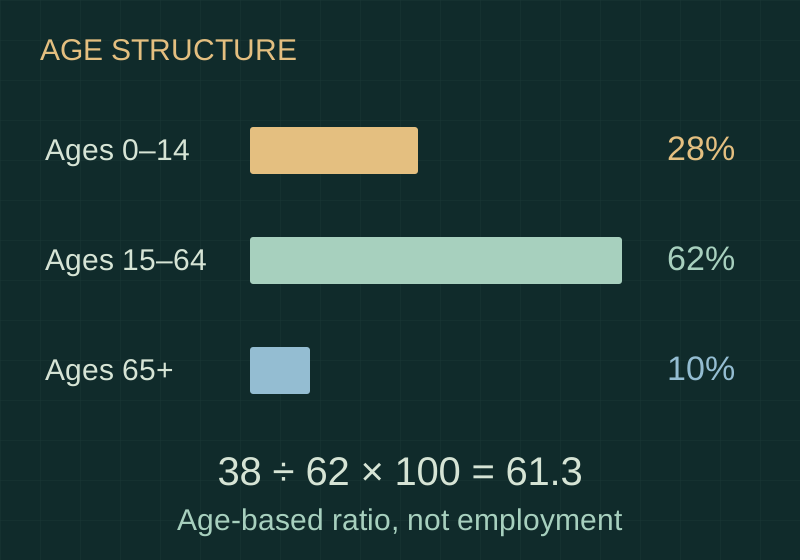
The conventional total age-dependency ratio is 100 multiplied by the population aged 0–14 plus the population aged 65 and over, divided by those aged 15–64. In the hypothetical example, 28 children and 10 older people for every 62 people aged 15–64 produce 61.3 per 100. That is not a claim that 61.3 per cent of the whole population is dependent: the denominator is the 62-person age group, not all 100 people.
Demography is not a payroll
Age thresholds do not establish who works, earns, studies or provides care. Some older people are employed, many adults aged 15–64 are not, and unpaid work is economically important. Child and older-age ratios should therefore be examined separately, alongside labour-force participation, health and household circumstances. The measure is useful for comparing age composition; it cannot substitute for an assessment of actual economic dependency or people’s contribution to society.